Use show opposite sign to reflect net income correctly on an income statement using NAV account schedules
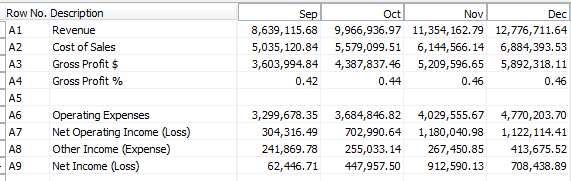
Posted: December 11, 2012 Filed under: Uncategorized | Tags: Account Schedules, accounting, financial statement, income statement, net income, show opposite sign, tips and tricks, two consecutive operators Leave a commentOne of the concepts I see students in my NAV account schedules class get stuck on is exactly how to use the show opposite sign function when constructing an income statement. It can be a bit mysterious why it behaves the way it does, and it seems to defy the rules of accounting and basic arithmetic all at the same time. Once you understand why it works the way it does, you’ll know how to use it in the future. From the example shown here, we see a very basic income statement.
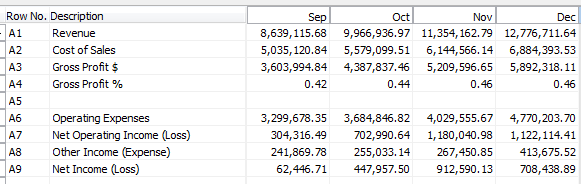
Without using any numbers yet, let’s all agree on some basic calculations:
Revenue – Cost of Sales = Gross Profit $
Gross Profit $ / Revenue = Gross Profit %
Gross Profit $ – Operating Expenses = Net Operating Income (Loss)
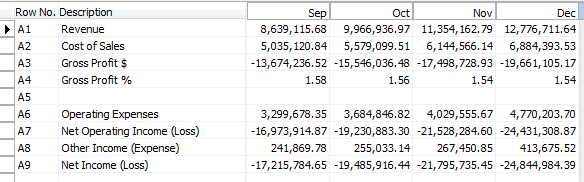
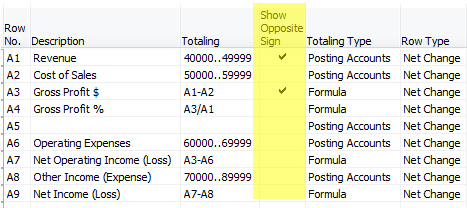
Putting these basic calculations into the design view for this account schedule gives the result below. Notice we’re not going to use the show opposite sign function yet, or make any changes to the basic formulas we just defined.
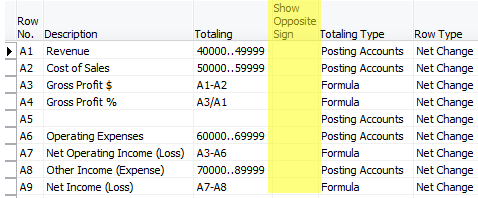
When we look at the report view for this account schedule we see that we’ve got a significantly wrong result. The revenue is showing as a negative number and all of the calculations below it are incorrect.
Now, for the accountants out there, you may already have guessed what the problem is. When accounting for revenue, these numbers are assigned a credit value, which shows up as a negative. Most financial statement end users want to see this reflected as a positive number. This is where we need to use show opposite sign. Let’s add that in to the design view, as shown below.
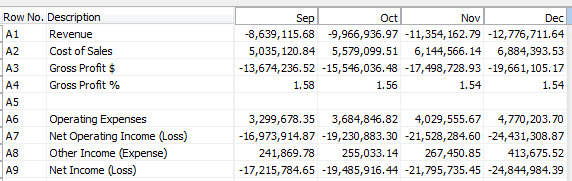
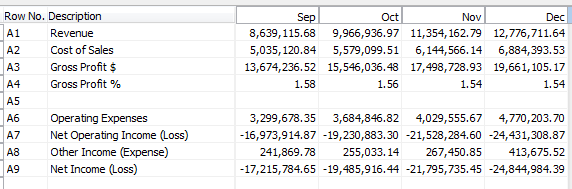
When we look at our new result, you would think all would be correct. We’ve corrected the accounting problem by flipping the sign. However, when you look at the result, we get the following.
Why in the heck is that gross profit number not right? It seems we’ve got very simple math we’re dealing with here, what could be the problem? Many folks at this point go for the simple solution – just select show opposite sign on the gross profit $ line.
Unfortunately, this doesn’t work either, because you are flipping the sign on both the revenue value as well as the cost of sales value and you simply get the opposite of the same wrong number you got above.
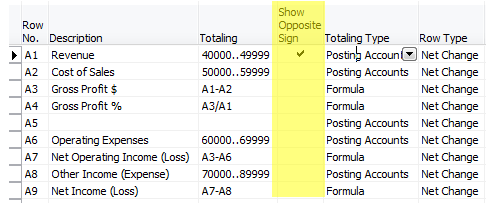
The reason this is happening is because the show opposite sign function is doing exactly what it says it is doing, it is SHOWING the opposite sign. This is really only a presentational mask, and when calculations are done against the value, revenue is still calculating as a negative number, even though it appears on your report as a positive number. This little bit of arithmetic defying programming can make an accountant a little cranky, but it is easy to solve with a little mathematic trickery. In order to fix this, we need to put into place a two part solution. The first part we already know; we must select show opposite sign for our revenue accounts. The second part manipulates the Gross Profit $ and Gross Profit % as shown below, changing the value of the revenue account within the equation in order to calculate correctly.
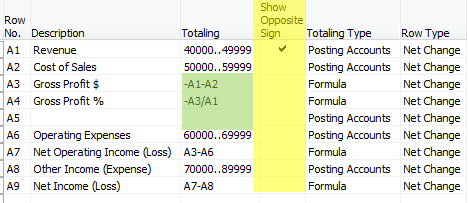
The end result gets us correct results every time.
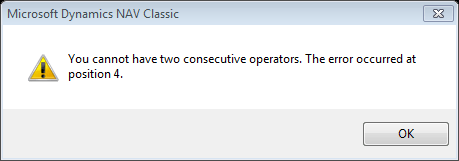
For those of you who are really paying attention, there is one more math mystery in the show opposite sign puzzle. Why have I chosen to show the calculation for Gross Profit % as -A3/A1 instead of simply using A3/-A1? Again, we’ve got to defy the programming with math tricks. Choosing A3/-A1 gives the error shown below. Get around it by moving the negative value to the other side of the equation and you’re good to go.
This posting is one of the Top 20 Most Viewed in the last year! Follow this link to see the entire list.
Tis the (Budget) Season! Three handy NAV account schedule tips to get you through
Posted: October 23, 2012 Filed under: Uncategorized | Tags: Account Schedules, budgets, column layout, NAV, row setup, tips and tricks Leave a comment I don’t know about your company, but my company is in full budget preparation mode. We’re working on getting our sales forecast and operating budgets put together in time for the end of year. Like most companies, we’re working on this predictive tool while we’re in the midst of finishing out the year, so of course, we get to make a few assumptions on how the year will end up. I don’t have a crystal ball, but I do have some pretty great account schedules that help folks at my company get a good solid look at where we ended up last year, what we planned for this year, and how we’ve done over a couple of years, and I’m going to share those three account schedule column layouts with you today. Hopefully these simple setups will give you some quick ways to wow your company and make their budget construction process easier.
Tip 1: Show 12 months of actual data
We ask our budget managers to give us a twelve month prediction, why shouldn’t we give them twelve months of data to work with? No matter what month you’ve just closed, you can quickly put together an account schedule that shows all of the completed months for the year (in this case, January-September) as well as October/November/December of the prior year. This way, if your activity is generally the same year over year, budget managers can get a quick gauge from this setup. Keep in mind this column layout isn’t dynamic, so it’s not a true rolling twelve months. For budgeting purposes, it’ll get you what you need.

Tip 2: Show 9 months of actual data and show what the plan is for the last three months of the year
Another way to provide a projection for the year is to show all the completed months for the year (again, January-September) and then show the budgeted plan for October/November/December. This method shows actual activity as well as three months of planned activity in order to project the total for the year. If activity this year is significantly different (higher or lower) from the year prior, you might depend on this view instead.

Tip 3: Show a whole bunch of history at a high level
Especially for sales forecasting, it sometimes gets difficult to look at too much data at once. One way to get past data analysis overload is to provide a few years’ worth of annual data. This column layout will give four years of data, helping you to compare not only year over year, but multiple year trending in your data.

All three of these tips should give you a few additional tools to help you make sense of a whole lot of data. They can be applied to almost any row setup you have whether that setup is related to revenue or expenses. If you’re looking for more formulas, visit the account schedule formulas page.
Happy Budgeting!
This posting is one of the Top 20 Most Viewed in the last year! Follow this link to see the entire list.
Challenge to the NAVUG Community: NAV Account Schedules formulas cheat sheet
Posted: October 15, 2012 Filed under: Uncategorized | Tags: Account Schedules, challenge, cheat sheet, formulas, NAV, NAVUG, NAVUG Academy, tips and tricks, user group Leave a comment I had the opportunity today to teach a full day class on account schedules to an amazing engaged group of people! I get the privilege of doing this in person once a year at NAVUG Forum thanks to NAVUG Academy. In the last year, I’ve branched out to teach this same class in webinar format, and boy has it been a blast. The number one question I get is, “Do you have a cheat sheet for all the formulas you can use in Account Schedules?”
I’ve shied away from this in the past, because it’s a complex question. You’ve got to take into account comparison period versus comparison date, column type used, use of filters, and like all Microsoft products, there is often more than one way to accomplish the same result. But I think I’ve got us a start with the page I’ve just put out on my blog.
I believe the power of community is an amazing thing. We continually make each other better by sharing information.
I CHALLENGE YOU TO SUBMIT A COMMENT WITH AN ACCOUNT SCHEDULE FORMULA THAT’S NOT YET BEEN LISTED.
As long as I can test it to prove it works in the way described, and it’s different enough from already listed formulas, I’ll add it to the list and make sure to put a shout out to the contributor on the blog.
I’m looking forward to seeing what our amazing NAVUG community can accomplish!


Expand your use of dimensions in NAV account schedules by using analysis views
Posted: October 2, 2012 Filed under: Uncategorized | Tags: Account Schedules, analysis views, budgets, Classic Client, codeunit 410, column layout, date compression, dimensions, Dynamics, Microsoft, NAV, row setup, RTC, update Leave a commentIf I had to pick only three basic elements to Microsoft Dynamics NAV account schedules, I’d have to choose row setups, column layouts and analysis views. Of course, row setups give you access to basic general ledger accounts and column layouts give you options on how to show that data in different time periods. So what do analysis views do for us? Analysis views give us the ability to reach into our dimensions, past the two globals, and into the list of shortcuts, allowing us to combine any four dimensions we want at a time in any account schedule.
For illustration, I’m showing you an account schedule from NAV2009 Classic, which shows the dimension filters on an account schedule where no analysis view has been applied. The two global dimensions for CRONUS USA (Department and Project) are available to be selected on the dimensions filter tab and the remaining options are greyed out, unable to be used.

By selecting a different analysis view on the account schedule name page, you will have expanded options. Perhaps you’d like to apply an entirely different set of dimensions filters to your account schedule or limit the dimensions filters to only two of your shortcut dimensions. Any combination of four dimensions is available to you through analysis views.


There are a few things you need to know about analysis views before you start using them:
You can add a default analysis view to any account schedule. If you always want a certain account schedule to filter on a selected group of dimensions, this is the best way to do this.

Analysis Views must be updated. You can do this at any frequency you wish. Some companies choose to update once a month, some companies update once a day. Be aware that the process of updating pulls in any transactions that have been posted since the last update to your analysis view. This means if you post some entries during your close process, you’ll need to update your analysis view in order to show the change on your account schedule.

Updating can be done manually or it can be automated. To manually update analysis views, just hit the update button. You’ll need to do each one separately. Alternatively, you can choose to schedule codeunit 410 Update Analysis View as a regularly scheduled maintenance item in order to automate this process.
When you set up an analysis view for the first time, it can take a long time to update. Depending on the size of your database, if you don’t limit how far back your update goes, it could take a long time to update initially. Be careful by trying this out in a test system first. This process, which will normally take seconds when run daily, will take many hours if you don’t limit it and will cause table locks for other users.
If you test out an update and are afraid it will take up too much processing time, you have a couple of options. First, you can limit the start date of your update. One reason you might need a new analysis view is because you’ve added a new dimension. In this case, you really don’t need to go back to the beginning of time on your update. Choose the date you started gathering data on your new dimension as your starting date. You can also choose date compression. By compressing your data by day, week, month, quarter, period, or year, you limit how much detail you can see when you drill down. If you use this option, you’ll need to remember that this is a compressed view if you change column layouts to different time frame than your compression setting. Choosing date compression of none will allow you to drill down to full transactional detail.
Avoid using the update on posting button. This option updates your analysis view every time you post something to your system. Every sales order, every sales tax entry, every cash receipt, etc. will update real time. I’ve seen one small company use this option and it brought their system performance to a crawl.
Remember to include your budgets. If you make any changes to your budgets, you need to update that information on your analysis views as well.

Basic column layout options for NAV Account Schedules
Posted: September 10, 2012 Filed under: Uncategorized | Tags: Account Schedules, balance at date, Classic Client, column layout, comparison date formula, comparison period formula, financial statement, fiscal year, general ledger, NAV, net change, RTC 5 CommentsColumn layouts in NAV account schedules are what you build to add more flexibility to your financial statements. You can have an unlimited number of column layouts to match together with your already existing row setups. In general, most basic row setups contain general ledger numbers and column layouts contain dates. As an example, when I produce my income statement, I will have one row setup that reflects a summarized income statement and at least four different column layouts that reflect different configurations of month to date, year to date, comparisons against budget, and twelve month trended views.
Just like with row setups, there are many available options in the column layouts. This large variety of options can sometimes be overwhelming to the new account schedule user. I’ll show you which columns to choose in the column layouts for account schedules as a beginning point, and go through some simple explanations of how they are used.
Fields to start with:
Column No. – The column number is completely optional, but highly recommended. This simple element of the column layout will eventually be one of the key features of your account schedule, allowing you to calculate and organize with ease.
Column Header – This is where you’ll define, in words, what you’re showing in each column of your report. Keep it short; there is a 30 character limit.
Column Type: Net Change, Balance at Date, or Formula – There are actually seven options to choose from here, but I recommend that you limit yourself to these three when you’re just getting started. The key here is knowing what type of accounts you’re reporting on. If you’re using income statement accounts (Revenue/Expense), then you need to use net change. If you’re using balance sheet accounts (Assets/Liabilities), then you need to use Balance at Date. Formula allows you to perform calculations in a column.
Ledger Entry Type – This column will allow you to define what type of ledger entries you will show. This is where you can choose actual general ledger entries or budgeted general ledger entries.
Formula – If you’ve chosen Formula as the Column Type, this is where you’ll put the formula.
Comparison Period Formula – This column allows you to define date formulas that are used to calculate the amounts shown. I generally recommend that beginning account schedule users start out using the comparison period formula field instead of the comparison date formula field. The comparison period formula field references the accounting periods set up in the fiscal year, so this option seems the most consistent, and is especially necessary for companies that may not follow a calendar fiscal year. Common data labels used in this field are CP for current period or -1CP for previous period and FY for fiscal year or -1FY for prior year.
Shown below are both the design view and the user view of a column layout for a summarized income statement showing year to date and prior year to date information in the columns to demonstrate the use of these six basic options in an account schedule.
Role Tailored Client


Classic Client


For more information on row setups, please see these posts: Basic row setup options for NAV Account Schedules and Complete row setup options for NAV account schedules.
If you’re just beginning to use account schedules, see Getting started with a new account schedule.
This posting is one of the Top 20 Most Viewed in the last year! Follow this link to see the entire list.
The NAV user community wants the ability to copy and paste rows in the RTC
Posted: August 13, 2012 Filed under: Uncategorized | Tags: Account Schedules, copy and paste, ilovenav, Microsoft, NAV, RTC 3 CommentsAs a long time account schedule user, I was pretty excited to see how the role tailored client would change or enhance account schedules. I got my hands on a copy of the Cronus database with the role tailored client and began to test drive my existing account schedules. I discovered a few things that were really great, a few things that were a bit of a step back, but one thing that was a real problem. In the role tailored client, account schedules had completely lost the ability to copy and paste rows from one schedule to another. This was a problem because it was a gigantic efficiency loss in account schedules functionality. Really? Was this such a big deal? Let me give you some examples of how I use this capability which is alive and well in all prior versions of NAV.
1) Creating slightly different versions of a similar column layout. If I create a monthly net change column layout, I can easily create a monthly balance column layout, or a monthly budget column layout, simply by copying the original column layout and changing one variable on the new layout. Copy and paste allows me to create three valuable looks for one report in less than a minute.
2) Testing or trouble shooting a new schedule. I’ll frequently take an existing schedule and change it to serve a different purpose. When doing this, I’ll copy the existing one that I know works, and then paste it into a new schedule to try what I want on it. This ensures I start with setup information exactly the same as the one I know works, so I don’t have to doubt whether I missed something. I can just change what I need for the new schedule and test the new variables one at a time.
3) Section replication. If I have a schedule where I need a section to repeat, I can copy the existing one and paste it in the new spot.
So what do you do in the RTC in order to accomplish any of these things? The answer is: you have to retype and reselect options for the entire schedule manually. Ugh. Really Microsoft?
I’ve talked to a bunch of folks about this. At first, I thought there was just something I was missing, some new navigational feature that I hadn’t yet figured out. The best story I’ve gotten was that with changing account schedules to the matrix form, they just weren’t able to bring along clipboard functionality. Account schedules isn’t the only area in RTC where the copy and paste ability are gone.
The NAV user community has definitely spoken loud and clear about this. An organization called ilovenav asks users:
 “Help us make Microsoft Dynamics NAV an even better product. Please submit and vote on your favorite product suggestions for Microsoft Dynamics NAV. Our goal is to crowd-source this feedback to Microsoft and pick suggestions that we can develop and distribute to the community free of charge”.
To date, there are 161 votes for this fix, and this is the most requested fix registered on the site. Matt Traxinger, the admin for the site says, “This has been announced for NAV 2013. It is not known whether they will include it in a service pack for NAV 2009.”
I think users can make a difference in what happens with their product, and I firmly believe that Microsoft is listening. I see evidence of this again and again in the awesome features they continue to release in the tools we all use every day. If you’ve read this blog for a while, you already know I’m a big account schedules advocate, but I really think Microsoft goofed on this one.
Save yourself a lot of typing and save new NAV users some frustration. Get out there to the ilovenav site and cast your vote for this important product suggestion.
Can you use NAV account schedules to create a statement of cash flows? Yes, you can!
Posted: August 1, 2012 Filed under: Uncategorized | Tags: Account Schedules, financial statement, NAV, statement of cash flows 1 CommentJohn Bellinger of Archerpoint recently posted a great article illustrating how to use account schedules to build the statement of cash flows, using both the indirect as well as the direct methods. For those of you who have struggled with this sometimes challenging financial statement using NAV account schedules, find your answers here!
Here’s a bit from his recent posting:
This blog is an attempt to document how a Cash Flow Statement can be created using standard NAV Account Schedules.
I’ve been asked a few times by Finance Type individuals for a Cash Flow Statement report (yes there is not an out of the box report . . . darn!). It usually takes me a couple attempts to explain how to accomplish using Account Schedules, and I usually kick myself for not keeping an example on hand.
As some may know, there are two methods, Direct and Indirect, that can be used for a Cash Flow Statement. I understand the Indirect Method is the more common of the two, regardless I choose to do both in this blog. Other than the operating activities section, the methods are similar. A well-structured chart of accounts will greatly assist in setup/maintenance of this Account Schedule. You’ll see from my examples that I’m largely using Total Accounts to accomplish; hopefully this will eliminate the necessity to reconsider this account schedule if new accounts are setup in the future. For those of you that are new to NAV or have not yet implanted NAV, a good exercise may be to consider the necessary structure to accomplish a cash flow statement. This may dictate certain accounts/structure in your chart of accounts for your reporting requirements.
For the rest of his posting, including some really useful screen shots to illustrate what he’s showing, follow the link below.
http://www.archerpoint.com/blog/Posts/using-nav-account-schedules-create-cash-flow-statements
Complete row setup options for NAV account schedules
Posted: July 30, 2012 Filed under: Uncategorized | Tags: Account Schedules, balance at date, Classic Client, column layout, dimensions, Excel, export to excel, financial statement, general ledger, microsoft dynamics nav, NAV, net change, posting accounts, row setup, RTC, set base for percent, setup options, show opposite sign, totaling type, trial balance 1 CommentAbout a month ago, I published a post called Basic row setup options for NAV account schedules. This is a great place to look if you’re just getting started. However, if you’re looking for what else you can do with Microsoft Dynamics NAV account schedules, then this is where you want to be. This post will go through each and every field available on the account schedule row setup and talk about the available options. The functionality of these fields are exactly the same between the Classic and Role Tailored Clients. The only difference is in how they look on the screen and how you navigate between screens. Take a look at the pictures below to find the look you’re familiar with, but then keep reading for the explanations of what these fields will do in your financial reporting.
Role Tailored Client
This is a view of what I recommend you start with for basic row setup options.

This is a view of all available row setup options.

Classic Client
This is a view of what I recommend you start with for basic row setup options.

This is a view of all available row setup options.

Row setup options – apply to both clients
Row No. is completely optional, but highly recommended. This simple element of the row setup will eventually be one of the key features of your account schedule, allowing you to calculate and organize with ease.
Description is the one place you have to communicate, in words, what you’re showing on each line of your report.
Totaling Type: 6 options to choose from
- Posting Accounts pull data from your accounts designated as posting accounts on the G/L Account Card Account Type field.
- Total Accounts pull data from your accounts designated as a total or as an end-total on the G/L Account Card Account Type field.
- Formula allows you to calculate a basic formula on this row.
- Underline places a single underline .
- Double Underline places a double underline.
- NOTE: This nifty addition showed up with NAV 2009 R2. If you are NAV 2009 SP1 or earlier, this won’t be available to you.
- Both of the underline functions are there to give folks who print account schedules directly out of NAV some formatting options. If you’re exporting to Excel you’ve got some better format options to work with than these.
- Set Base for Percent allows you to designate which row from your row setup will be used as the beginning point for a section to be included in a percent of total calculation. This feature showed up in version 5.0 and must be used together with a formula on another row to designate the end point of the section as well as some setup in the column layout. It’s a little fussy in the setup and inelegant in execution, but is still effective to get those vital comparative percentages onto your account schedules.
Totaling will be which general ledger accounts you want to pull or what formula you want to calculate, depending on what you selected in totaling type.
Row Type: 3 options to choose from
- Net Change should be used, generally, if you’re reporting on income statement accounts (revenue/expense).
- Balance at Date should be used, generally, if you’re reporting on balance sheet accounts (assets/liabilities).
- Beginning Balance will be sparingly used, but you’ll want this for your statement of cash flows at some point.
Amount Type gives you three options: Net Amount, Debit Amount and Credit Amount. You’re going to use Net Amount almost all the time, but I suppose if you were getting very granular in your account schedules and perhaps using them for detailed reconciling reports, this might be useful. If I’m getting down to this level of transactional detail, I’m usually going to the chart of accounts instead of account schedules.
Formatting Fields: Bold, Italic, and Underline These basic formatting fields are there to allow you to emphasize some of the rows of your account schedules. When you select these options on any row, the whole row is effected. You are not able to effect a single “cell” for formatting. What’s the difference between underline here and underline found in the Totaling Type options? You can get a more snug fit on your underline using this option since it appears in the same row of your data instead of in a row if its own.
New Page inserts a page break. This is commonly used when separating the pages of the balance sheet showing assets on the first page and liabilities and equity on the second page. I have also seen it used when folks build multi page account schedules.
Show Opposite Sign is the option you can select to change revenue credit balances or expense debit balances to the opposite sign for the purposes of presenting this data in a more non-finance friendly manner. No salesperson wants to see sales presented with a negative sign; use this to change that credit to a positive number on your reporting.
Show allows you to designate if a row will show (the default) or be hidden on the printed account schedule only. You can click this box as much as you want, but your rows will still show on-screen or when you export to Excel. If you print directly out of account schedules, this feature will work very well for you.
Dimension Totaling is the last option available and you might have noticed that I didn’t show them on pictures above. This is because they are unique for just about every user, and depending on your analysis view setup, may even be different from schedule to schedule. You can use just one, or you can use all four of the available dimension totaling fields, in whatever combination you like. These fields act very much like the Totaling field because this is where you will tell NAV what Dimensions you want shown and totaled from your general ledger accounts.
This posting is one of the Top 20 Most Viewed in the last year! Follow this link to see the entire list.
NAV Error Message: G/L Account No. ” does not exist
Posted: July 16, 2012 Filed under: Uncategorized | Tags: Account Schedules, consolidation, error, financial statement, general ledger, NAV 1 CommentI was merrily finalizing my financial statements last week, and got this error when running my consolidation. I had successfully run my consolidation error free for over a year, so in disbelief, I immediately reran it, expecting a change in result. Same error. I began to run the mental check list. What was different? What had changed?

Of course! I had added a new account at the end of the year, and this month was the first month there was activity in the account. Not remembering exactly what I did six months ago, I rechecked my work.
- I had added the new account on my main company
- I had added the new account on my consolidation company
I reran the consolidation; still the same error. What was I missing? The culprit was the Consolidation tab on the on the G/L Account Card. I only had it set up correctly in the consolidation company and had missed filling out these same fields on the main company. I needed for this to be filled out exactly the same on both cards in order for this to work. I fixed the two fields, and voila!, my consolidation was back to its usual, reliable old self and finished up like a champ.
 The culprit, showing missed fields
 Now properly filled out
Just for good measure, I took a quick tour through my account schedules to make sure I had incorporated this new account either through ranges or individually so this new activity would also be properly captured in the financial statements.
This error can occur in other places, and in plain English is basically telling you that you’ve missed some setup where a general ledger account must be defined. That nifty little double apostrophe means “blank” to NAV. I put “NAV G/L Account No. ” does not exist” into BING looking for someone who may have answered this question before, so if you’re looking for a solution for this error in other areas, try these links.
http://support.microsoft.com/kb/2274642 Microsoft hotfix available when error is generated when you run the export to excel function on the analysis by dimensions reporting in the Spanish version
http://www.mibuso.com/forum/viewtopic.php?t=52338 when posting a sales credit note
http://dynamicsuser.net/forums/p/279520/279520.aspx when posting an invoice
")

