nChannel lists Dynamics NAV Financials as a top Microsoft Dynamics NAV Blog
Posted: April 30, 2013 Filed under: Uncategorized | Tags: Account Schedules, budgets, Dynamics, financial reporting, Microsoft, NAV 1 Comment nChannel gave Dynamics NAV Financials a really nice mention in their recent listing of top Microsoft Dynamics NAV blogs.
Here’s a blurb from the article:
About the Blog: Kerry uses her extensive experience in Dynamics NAV to give readers an in-depth look at account schedules, financial reporting, dimensions, budgets and more. Readers can also follow the blog on Facebook, follow Kerry on Twitter and subscribe via email in order to receive notifications of new posts (the blog is updated often, with some days generating multiple posts).
For the full article, listing twelve other really fantastic NAV blogs and communities, click here!
Blogiversary Top 20 (#16) Tips and tricks for a flawless budget load in NAV
Posted: April 8, 2013 Filed under: Uncategorized | Tags: budgets, Excel, export to excel, NAV, tips and tricks Leave a commentWe’re celebrating our one year blogiversary by reposting the Top 20 Most Viewed in the last year, as determined by you, our readers! Follow this link to see the entire list. Enjoy!
Hopefully, you’ve completed your budget work for 2013 and all you need to do to finish is to load all that information to NAV so you can begin to report against your actual financial numbers. If you’ve done this before, you might already know that NAV’s budget tool can be a bit fussy and also a bit cryptic about why it won’t accept your carefully prepared data. Here are four quick tips to help you with getting that data into NAV quickly, correctly, and in one try.
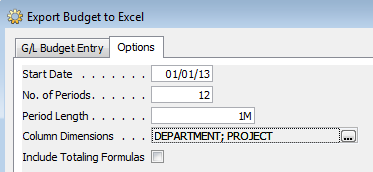
1. Export first, then import. This is the single most important detail about getting budget data loaded into NAV. You can choose to export an existing budget or even choose to export a blank new budget. Exporting a budget as your first step establishes a working template you can populate your data into, including dimensions. As long as you start with this template, you are already most of the way there to a successful NAV budget load.
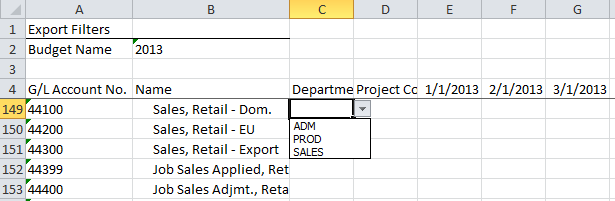
2. If you’re using dimensions, validate your data against the provided drop downs. Make sure all budget lines that use dimensions are only using valid dimension names. Any deviation from the allowable values that already exist in NAV can cause your budget load to error out or load without balancing.
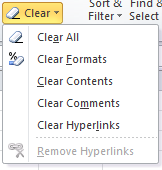
3. Clear the formats from your numbers. Once you’ve copied and pasted or typed your numbers into your Excel template, use the Excel “Clear Formats” function on all cells that contain a numeric value to make sure they are all returned to a formatted status of general. NAV does not accept any other format than the one in the template, and use of other formats, including use of commas in the numbers, will cause the budget tool to give an error and keep you from loading your budget successfully.
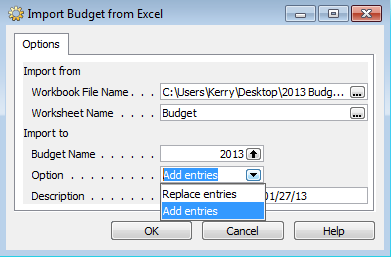
4. Use the “Add Entries” option for a brand new budget load and the “Replace Entries” option for a subsequent version. The add entries option should only be used for a brand new budget load, otherwise the entries will be added on top of the already existing entries, doubling or tripling them. If you need to load a second or third version or some type of correction, always use the replace entries option instead of the add entries option. If you really get stuck with a bunch of errors, the best thing you can do is delete your budget and reload from scratch.
Take one last look through your data to make sure it’s accurate and exactly what you expected. You can use the budget tool to do this, or even better, put together a quick account schedule that shows your entries using “G/L Budget Entries” instead of “G/L Entries”. Make sure to look at your total balances, balances by fiscal period, and balances with dimension filters applied. Once you’re satisfied that all your budgeted data has loaded correctly and completely, you’re ready to produce financial reporting showing actual versus budgeted numbers!
Blogiversary Top 20 (#17) Tis the (Budget) Season! Three handy NAV account schedule tips to get you through
Posted: April 5, 2013 Filed under: Uncategorized | Tags: Account Schedules, budgets, column layout, NAV, row setup, tips and tricks Leave a comment We’re celebrating our one year blogiversary by reposting the Top 20 Most Viewed in the last year, as determined by you, our readers! Follow this link to see the entire list. Enjoy!
I don’t know about your company, but my company is in full budget preparation mode. We’re working on getting our sales forecast and operating budgets put together in time for the end of year. Like most companies, we’re working on this predictive tool while we’re in the midst of finishing out the year, so of course, we get to make a few assumptions on how the year will end up. I don’t have a crystal ball, but I do have some pretty great account schedules that help folks at my company get a good solid look at where we ended up last year, what we planned for this year, and how we’ve done over a couple of years, and I’m going to share those three account schedule column layouts with you today. Hopefully these simple setups will give you some quick ways to wow your company and make their budget construction process easier.
Tip 1: Show 12 months of actual data
We ask our budget managers to give us a twelve month prediction, why shouldn’t we give them twelve months of data to work with? No matter what month you’ve just closed, you can quickly put together an account schedule that shows all of the completed months for the year (in this case, January-September) as well as October/November/December of the prior year. This way, if your activity is generally the same year over year, budget managers can get a quick gauge from this setup. Keep in mind this column layout isn’t dynamic, so it’s not a true rolling twelve months. For budgeting purposes, it’ll get you what you need.

Tip 2: Show 9 months of actual data and show what the plan is for the last three months of the year
Another way to provide a projection for the year is to show all the completed months for the year (again, January-September) and then show the budgeted plan for October/November/December. This method shows actual activity as well as three months of planned activity in order to project the total for the year. If activity this year is significantly different (higher or lower) from the year prior, you might depend on this view instead.

Tip 3: Show a whole bunch of history at a high level
Especially for sales forecasting, it sometimes gets difficult to look at too much data at once. One way to get past data analysis overload is to provide a few years’ worth of annual data. This column layout will give four years of data, helping you to compare not only year over year, but multiple year trending in your data.

All three of these tips should give you a few additional tools to help you make sense of a whole lot of data. They can be applied to almost any row setup you have whether that setup is related to revenue or expenses. If you’re looking for more formulas, visit the account schedule formulas page.
Happy Budgeting!
DynamicsNAVFinancials blog celebrates one year with top 20 postings
Posted: April 1, 2013 Filed under: Uncategorized | Tags: Account Schedules, budgets, Classic Client, Convergence, dimensions, Dynamics, Excel, export to excel, financial reporting, financial statement, general ledger, NAV, NAV 2013, NAVUG, payment terms, PowerPivot, tips and tricks, user group 2 Comments It’s our blogiversary! I started this blog in April 0f 2012, inspired by the number of NAV end users I had met over the last year who had the same questions that just weren’t getting answered. What better way to get that information out to folks than a blog where I could write up the topic in an easy to understand way?
You’ve shown your support! Over that last year, we’ve had over 15,000 views, almost 100 followers via email, have people following us on our new Facebook page, and know that many of you follow postings through the RSS feed. People from more than 120 countries are reading DynamicsNAVFinancials! The blog has gotten enough attention to be picked up for syndication through Microsoft Dynamics Community and I was even asked to participate as one of the eleven official bloggers at Microsoft Dynamics Convergence 2013 last month.
Special thanks has got to go to the NAVUG. The user group has been especially supportive of me and of the blog, finding opportunities for me to speak to NAV users in person, in webinars, online classes, and through this blog. Without the support of the user group this would have been a much longer road and I am so grateful for the constant work they have done to get me in front of as many readers as possible.
Publishing over an entry a week in the last year, there’s a lot to choose from, but in the month of April, I’ll be re-running the top 20 postings determined by the most viewed entries. Enjoy, and thank you so much for reading! There would be no reason to do this without you!
19 The NAV accountant’s little helper: the reconciliation account check box
18 Learning about Microsoft Dynamics NAV 2013: on demand learning from NAVUG is a fantastic resource!
17 Tis the (Budget) Season! Three handy NAV account schedule tips to get you through
16 Tips and tricks for a flawless budget load in NAV
15 Why NAV users should be using dual monitors
14 Video Demo: How to export NAV account schedules to Microsoft Excel
13 Basic row setup options for NAV Account Schedules
12 Aging methods in NAV – which buckets are you looking for?
11 Complete row setup options for NAV account schedules
10 Learning about Microsoft Dynamics NAV 2013
9 Where can I learn more about NAV analysis reports and analysis by dimensions?
8 10 easy tips for payment terms success in Microsoft Dynamics NAV
6 Getting started with a new account schedule
4 Maximize your Microsoft Dynamics NAV 2009 Classic screen space with user level configuration options
3 Basic column layout options for NAV Account Schedules
2 NAV keyboard shortcuts – Classic to RTC
1 The Account Schedules Formulas Page
NAV dimensions in budgets and consolidations (part 12 of 15)
Posted: March 26, 2013 Filed under: Uncategorized | Tags: Account Schedules, budgets, Classic Client, consolidation, dimensions, financial reporting, financial statement, global, NAV, shortcut Leave a commentNow that you know you can view dimensions on postings and in financial reporting though account schedules, let me show you how you can utilize dimensions in budgets. NAV budgets opens up a few more possibilities for you where dimensions are concerned. Take a look at this screen shot, using the classic client, that shows clearly what the available dimensions are in budgets.
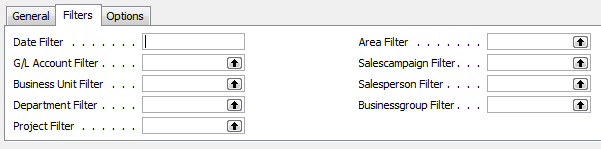 If you look at the left side, you can see the persistent global dimensions of Department and Project which the test database for Cronus uses. Just like all areas of NAV, global dimensions are available everywhere, even in budgets. On the right hand side, you can actually see four more dimensions. These are shortcut dimensions and if you count, you can see you’ve got a total of six dimensions available with NAV budgets to use for your planning process. As long as you budget for a dimension then you can report actual versus budgeted against that dimension.
In addition, you can also see there is a field called business unit filter, which I’ve always counted on as a “bonus” dimension. This field becomes useful when you have multiple companies in NAV and use them to consolidate your financial statements. I’ve got a very simple setup where I have two companies and a consolidation company. When I consolidate my statements monthly, and when I load my budgets, I designate the business unit filter for each of the two companies so I can report on them individually as well as together, on a consolidated level. Because I use separate companies with the business unit filter I don’t need to use a dimension to designate company for my financial statements.
Keep reading this month as we continue our series, 15 Days of NAV Dimensions.
Tips and tricks for a flawless budget load in NAV
Posted: January 21, 2013 Filed under: Uncategorized | Tags: budgets, Excel, export to excel, NAV, tips and tricks 1 CommentHopefully, you’ve completed your budget work for 2013 and all you need to do to finish is to load all that information to NAV so you can begin to report against your actual financial numbers. If you’ve done this before, you might already know that NAV’s budget tool can be a bit fussy and also a bit cryptic about why it won’t accept your carefully prepared data. Here are four quick tips to help you with getting that data into NAV quickly, correctly, and in one try.
1. Export first, then import. This is the single most important detail about getting budget data loaded into NAV. You can choose to export an existing budget or even choose to export a blank new budget. Exporting a budget as your first step establishes a working template you can populate your data into, including dimensions. As long as you start with this template, you are already most of the way there to a successful NAV budget load.
2. If you’re using dimensions, validate your data against the provided drop downs. Make sure all budget lines that use dimensions are only using valid dimension names. Any deviation from the allowable values that already exist in NAV can cause your budget load to error out or load without balancing.
3. Clear the formats from your numbers. Once you’ve copied and pasted or typed your numbers into your Excel template, use the Excel “Clear Formats” function on all cells that contain a numeric value to make sure they are all returned to a formatted status of general. NAV does not accept any other format than the one in the template, and use of other formats, including use of commas in the numbers, will cause the budget tool to give an error and keep you from loading your budget successfully.
4. Use the “Add Entries” option for a brand new budget load and the “Replace Entries” option for a subsequent version. The add entries option should only be used for a brand new budget load, otherwise the entries will be added on top of the already existing entries, doubling or tripling them. If you need to load a second or third version or some type of correction, always use the replace entries option instead of the add entries option. If you really get stuck with a bunch of errors, the best thing you can do is delete your budget and reload from scratch.
Take one last look through your data to make sure it’s accurate and exactly what you expected. You can use the budget tool to do this, or even better, put together a quick account schedule that shows your entries using “G/L Budget Entries” instead of “G/L Entries”. Make sure to look at your total balances, balances by fiscal period, and balances with dimension filters applied. Once you’re satisfied that all your budgeted data has loaded correctly and completely, you’re ready to produce financial reporting showing actual versus budgeted numbers!
This posting is one of the Top 20 Most Viewed in the last year! Follow this link to see the entire list.
Tis the (Budget) Season! Three handy NAV account schedule tips to get you through
Posted: October 23, 2012 Filed under: Uncategorized | Tags: Account Schedules, budgets, column layout, NAV, row setup, tips and tricks Leave a comment I don’t know about your company, but my company is in full budget preparation mode. We’re working on getting our sales forecast and operating budgets put together in time for the end of year. Like most companies, we’re working on this predictive tool while we’re in the midst of finishing out the year, so of course, we get to make a few assumptions on how the year will end up. I don’t have a crystal ball, but I do have some pretty great account schedules that help folks at my company get a good solid look at where we ended up last year, what we planned for this year, and how we’ve done over a couple of years, and I’m going to share those three account schedule column layouts with you today. Hopefully these simple setups will give you some quick ways to wow your company and make their budget construction process easier.
Tip 1: Show 12 months of actual data
We ask our budget managers to give us a twelve month prediction, why shouldn’t we give them twelve months of data to work with? No matter what month you’ve just closed, you can quickly put together an account schedule that shows all of the completed months for the year (in this case, January-September) as well as October/November/December of the prior year. This way, if your activity is generally the same year over year, budget managers can get a quick gauge from this setup. Keep in mind this column layout isn’t dynamic, so it’s not a true rolling twelve months. For budgeting purposes, it’ll get you what you need.
Tip 2: Show 9 months of actual data and show what the plan is for the last three months of the year
Another way to provide a projection for the year is to show all the completed months for the year (again, January-September) and then show the budgeted plan for October/November/December. This method shows actual activity as well as three months of planned activity in order to project the total for the year. If activity this year is significantly different (higher or lower) from the year prior, you might depend on this view instead.
Tip 3: Show a whole bunch of history at a high level
Especially for sales forecasting, it sometimes gets difficult to look at too much data at once. One way to get past data analysis overload is to provide a few years’ worth of annual data. This column layout will give four years of data, helping you to compare not only year over year, but multiple year trending in your data.
All three of these tips should give you a few additional tools to help you make sense of a whole lot of data. They can be applied to almost any row setup you have whether that setup is related to revenue or expenses. If you’re looking for more formulas, visit the account schedule formulas page.
Happy Budgeting!
This posting is one of the Top 20 Most Viewed in the last year! Follow this link to see the entire list.
Expand your use of dimensions in NAV account schedules by using analysis views
Posted: October 2, 2012 Filed under: Uncategorized | Tags: Account Schedules, analysis views, budgets, Classic Client, codeunit 410, column layout, date compression, dimensions, Dynamics, Microsoft, NAV, row setup, RTC, update Leave a commentIf I had to pick only three basic elements to Microsoft Dynamics NAV account schedules, I’d have to choose row setups, column layouts and analysis views. Of course, row setups give you access to basic general ledger accounts and column layouts give you options on how to show that data in different time periods. So what do analysis views do for us? Analysis views give us the ability to reach into our dimensions, past the two globals, and into the list of shortcuts, allowing us to combine any four dimensions we want at a time in any account schedule.
For illustration, I’m showing you an account schedule from NAV2009 Classic, which shows the dimension filters on an account schedule where no analysis view has been applied. The two global dimensions for CRONUS USA (Department and Project) are available to be selected on the dimensions filter tab and the remaining options are greyed out, unable to be used.

By selecting a different analysis view on the account schedule name page, you will have expanded options. Perhaps you’d like to apply an entirely different set of dimensions filters to your account schedule or limit the dimensions filters to only two of your shortcut dimensions. Any combination of four dimensions is available to you through analysis views.


There are a few things you need to know about analysis views before you start using them:
You can add a default analysis view to any account schedule. If you always want a certain account schedule to filter on a selected group of dimensions, this is the best way to do this.

Analysis Views must be updated. You can do this at any frequency you wish. Some companies choose to update once a month, some companies update once a day. Be aware that the process of updating pulls in any transactions that have been posted since the last update to your analysis view. This means if you post some entries during your close process, you’ll need to update your analysis view in order to show the change on your account schedule.

Updating can be done manually or it can be automated. To manually update analysis views, just hit the update button. You’ll need to do each one separately. Alternatively, you can choose to schedule codeunit 410 Update Analysis View as a regularly scheduled maintenance item in order to automate this process.
When you set up an analysis view for the first time, it can take a long time to update. Depending on the size of your database, if you don’t limit how far back your update goes, it could take a long time to update initially. Be careful by trying this out in a test system first. This process, which will normally take seconds when run daily, will take many hours if you don’t limit it and will cause table locks for other users.
If you test out an update and are afraid it will take up too much processing time, you have a couple of options. First, you can limit the start date of your update. One reason you might need a new analysis view is because you’ve added a new dimension. In this case, you really don’t need to go back to the beginning of time on your update. Choose the date you started gathering data on your new dimension as your starting date. You can also choose date compression. By compressing your data by day, week, month, quarter, period, or year, you limit how much detail you can see when you drill down. If you use this option, you’ll need to remember that this is a compressed view if you change column layouts to different time frame than your compression setting. Choosing date compression of none will allow you to drill down to full transactional detail.
Avoid using the update on posting button. This option updates your analysis view every time you post something to your system. Every sales order, every sales tax entry, every cash receipt, etc. will update real time. I’ve seen one small company use this option and it brought their system performance to a crawl.
Remember to include your budgets. If you make any changes to your budgets, you need to update that information on your analysis views as well.

Why I use NAV Account Schedules
Posted: April 25, 2012 Filed under: Uncategorized | Tags: Account Schedules, budgets, dimensions, Excel, financial statement, general ledger, NAV Leave a commentI use account schedules as the primary source of financial reporting at my company. With all the available choices out there, why do I use account schedules? I’ve got a whole list of reasons.
1) I can custom build all of my financial statements, exactly how I want to see them.
Especially when I talk with prospective NAV customers, I hear a lot of objections as to why NAV doesn’t come with “out of the box” financial statements. If you think about this for a bit, what part of your company’s financials might fit the definition of “out of the box”? Is your chart of accounts the same as someone else’s? What about the name of your accounts? Your numbering convention? Is the way you present your financial statements just like anyone else’s? If you built your financial statements using an out of the box solution, how long would it be before you began to customize them?
Why not build them the way you want them the first time and be able to customize them as your company changes?
2) Account schedules tie directly to the general ledger.
Someone told me once that reporting from the general ledger was the best way to get to the truth. Since my financial statements have got to be accurate and consistent above all else, I like this idea. I know, that without a doubt, my account schedules tie back to my trial balance and my detailed transactional postings. I can prove it out over and over. I can use my account schedules to debunk some of the untruths that come out of some of our other reporting sources. Knowing I can get to the truth makes me trust the results I get from account schedules and gives me confidence in deeming them as the place to get exactly the right answer.
3) Budgets integrate really well with account schedules.
I use the budgets area of NAV extensively. However, I only actually touch the budgets area once a year, when I populate them with our next years’ data. Budgets integrate to account schedules so fluidly that I have no reason to go back and forth between the two during the year as I track how we’re doing in comparison to budget or even as I look ahead to remind myself of what the plan was. I can get this information from account schedules and get all my financial information from one place.
4) Dimensions along with account schedules are a powerful combination.
Account schedules without dimensions are like James Bond without Q. James Bond can certainly hold his own without all the gadgets, but come on, the things that Q adds are really cool! Adding dimensions in almost as many combinations as you can think of gives you added power in your account schedules and lets you stretch beyond mere financial reporting and expand into operational reporting.
5) They export easily to Excel.
My monthly financial statement package is 18 pages, all produced out of account schedules. Each month, I export directly to Excel and produce reports that are consistently formatted and look the same every month. I’ve got good control over the process while still having the flexibility I need when we decide we want to make a change. All of this gets loaded up to SharePoint for the end users who use them, and no tree products are harmed in the production of our financials.
6) Account schedules can be built and maintained by finance folks without IT help.
This is, and always has been, the big seller for me. I’m a DIY kind of person. I do my own landscaping, I bake my own bread (not all the time), I can build a fire while camping, and I’m painting my own living room this spring. These same principles flow through to my business. I want to be able to do it myself. I love my IT colleagues, but goodness knows they have enough to do without having to produce my financials. Account schedules are easy enough to use that I don’t need to know a programming language, or how to accomplish a table join, in order to build them. All I need is knowledge of my chart of accounts, what the structure of my dimensions and budgets are, what the differences are between balance sheet and income statement accounts, and some simple formulas.
")

