NAV Account Schedules class offered only one time in 2014
Posted: July 3, 2014 Filed under: Uncategorized Leave a commentIf you’ve been following DynamicsNAVFinancials.com for a while you might know that up until 2014, I’ve taught both an annual in classroom class and multiple online classes for account schedules throughout the year. Due to a very busy schedule in 2014, I’m only offering my account schedules class one time in 2014.
I will be teaching a full day in person class at NAVUG Summit in St. Louis this year. I will be doing the class twice – on Monday, October 13th in NAV2013 and on Tuesday, October 14th in NAV2009 Classic. Follow the links to get to registration for this class and for more information about the conference.
The class is a full immersion day of nothing but account schedules. We will spend more than 50% of the time doing hands on exercises so you can easily learn and retain the material we cover in class. The class sizes are small so you will be able to have lots of one on one time to ask questions specific to your businesses. Since this class is only being offered one time this year, I encourage you to sign up early to make sure you get a spot.
See you there!

Week ten recap: Account Schedules 101
Posted: July 3, 2014 Filed under: Uncategorized Leave a comment Here’s the week 10 recap on the NAV Account Schedules 101 series. Follow the links below to view the posts for each of the lessons we covered this week or view the entire series here.
NAV AS 101 Lesson 24: When to change the sign
NAV AS 101 Lesson 25: What else can I do with Account Schedules?
Don’t forget to visit the Account Schedule Formulas and Account Schedule Examples pages if you’re looking for even more ideas on how to improve your financial reporting using account schedules with Microsoft Dynamics NAV.
NAV AS 101 Lesson 25: What else can I do with Account Schedules?
Posted: July 2, 2014 Filed under: Uncategorized Leave a comment I hope by now in this series you’ve realized there are a lot of other things you can do with account schedules other than produce base financial statements. Just in case you really don’t believe me, here’s my top 10 list of reports I produce using account schedules other than a trial balance, income statement, and balance sheet. Hopefully this list will spark some ideas of what else you might be able to do using account schedules!
#1 – Statement of Cash Flows – Ok, ok, I know this is a base financial statement, but there are soooo many people who are not using account schedules to produce this one. It can be done, I promise! The best advice I can give you is to make sure you understand your SCF well enough to be able to use your trial balance in order to construct it using Excel first. If you can do that, then you know enough to be able to build it in account schedules.
#2 – Gross Margin Reports – Since my company uses dimensions on our items at a high level grouping, as well as at a 1:1 level with the item, I’ve got some great gross margin reports that allow me to see what our margin is a number of different ways. I can see what larger groups of items are doing and I can also get down to the level of an individual item.
#3 – Reports that use the General Ledger account number in the columns – This is one of the shortcomings of NAV account schedules. You simply cannot design column layouts that utilize general ledger account numbers in the columns. I had someone request a general ledger walk forward from gross sales to net sales, showing columns for individual GL accounts like discounts and returns in the columns and then dimensions for our items in the rows. This would be a very ugly report if I was limited to only a few GL accounts in the rows and many many columns full of dimensions. I needed to twist this one around, and I did, by putting it into Excel and using Paste Special and Transpose.
#3 – Reports that answer specific questions like “How much did we spend on this activity for this project for this team”? – This starts to get into heavy dimension territory, and for this report, activity/project/team are all designated dimensions I have in my system in order to make this report possible.
#4 – Lead Schedules – When I review my accounts at the end of the year, and prepare for my auditors to arrive, I prepare lead schedules for both the balance sheet as well as the income statement, so I can easily review groupings of like accounts together and get quick year over year comparisons. I use the same lead schedule to monitor clearing accounts that need to have zero balances and also to make sure blocked accounts stayed blocked with a zero balance throughout the year. The lead schedules gives the auditors a consistent checklist of accounts to reference as they work through the annual audit and makes the inevitable variance discussions easier to handle.
#5 – Consolidated financial statements – I have more than one company to keep track of, and I do so using multiple companies in the same NAV database, and then use the consolidation feature to move all the financial detail to a single consolidation company to use for reporting. The consolidation company and the subsidiary companies all have a consistent shared chart of accounts, so it is very simple for each company to have consistent shared account schedules between them. If you look at an income statement in company A it looks exactly the same as company B because I copied and pasted the schedule from one company to another. Even if your chart of accounts is not the same between companies, you can still use consistent account schedules between companies with a little extra work needed to map accounts to the right lines.
#6 – Sales Every Day of the Month – We’ve got some great reports set up that give us daily information in NAV, and can break down, by dimension, what’s going on with things like sales so we can quickly identify trends.
#7 – Many Years of Information at a Time – I think a lot of times we get into the rut of what’s happened this month or this year, but when you start to work on forecasts or annual budgeting, bringing the view out to a higher level is a great tool. Don’t forget that you can look at many account schedules for a longer time frame as long as you’ve been gathering information in NAV for that long.
#8 – Budgets! – Other than once a year when I use the budgeting feature to load a new annual budget, I use account schedules to look at budgets. It’s a great way to get a quick read on what the plan was without having to switch out of my primary reporting tool.
#9 – Ratios – Need to see Accounts Receivable Turns or Days Sales in Receivables? What about Inventory Turns? There are a lot of ratios that can be measured using account schedules!
#10 Simple Queries – I’ve never really formalized this method, but I actually use it a lot. If someone asks me for detail on what we’ve spent on a project or what portion of a certain expense account a particular team has used, I can whip up a quick temporary schedule that will get me the info I need. I’ve found this particularly useful when needing to solve dimension problems. Using the ” (two single quotes) as a designator for finding “blank” dimensions was a great tool back in the day before I understood how to completely prevent that from happening, and by using an account schedule to show designated dimensions as well as blank dimensions, I was able to solve that type of problem quickly.
This posting is part of the NAV Account Schedules 101 series. Find the entire list of lessons here.
Don’t forget to visit the Account Schedule Formulas and Account Schedule Examples pages if you’re looking for even more ideas on how to improve your financial reporting using account schedules with Microsoft Dynamics NAV.
NAV AS 101 Lesson 24: When to change the sign
Posted: July 1, 2014 Filed under: Uncategorized Leave a commentOne of the concepts I see students in my NAV account schedules class get stuck on is exactly how to use the show opposite sign function when constructing an income statement. It can be a bit mysterious why it behaves the way it does, and it seems to defy the rules of accounting and basic arithmetic all at the same time. Once you understand why it works the way it does, you’ll know how to use it in the future. From the example shown here, we see a very basic income statement.
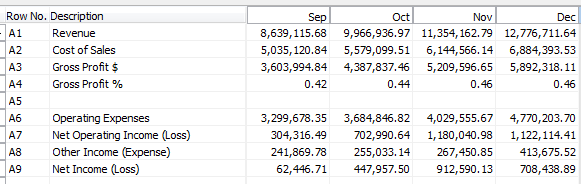
Without using any numbers yet, let’s all agree on some basic calculations:
Revenue – Cost of Sales = Gross Profit $
Gross Profit $ / Revenue = Gross Profit %
Gross Profit $ – Operating Expenses = Net Operating Income (Loss)
Putting these basic calculations into the design view for this account schedule gives the result below. Notice we’re not going to use the show opposite sign function yet, or make any changes to the basic formulas we just defined.
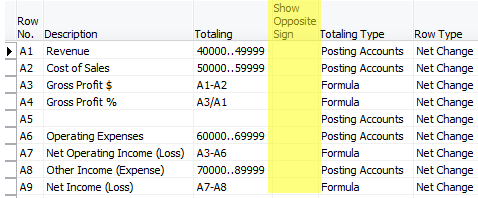
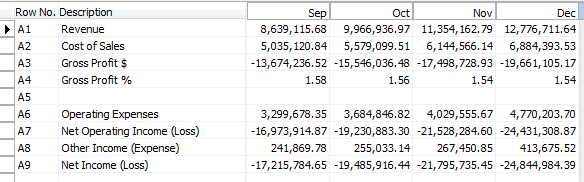
When we look at the report view for this account schedule we see that we’ve got a significantly wrong result. The revenue is showing as a negative number and all of the calculations below it are incorrect.
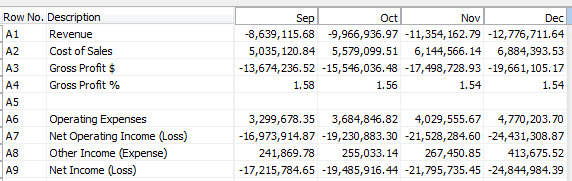
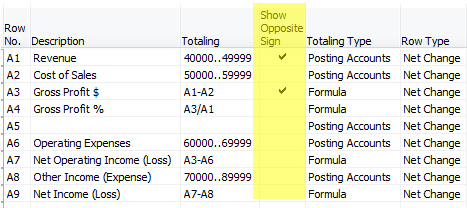
Now, for the accountants out there, you may already have guessed what the problem is. When accounting for revenue, these numbers are assigned a credit value, which shows up as a negative. Most financial statement end users want to see this reflected as a positive number. This is where we need to use show opposite sign. Let’s add that in to the design view, as shown below.
When we look at our new result, you would think all would be correct. We’ve corrected the accounting problem by flipping the sign. However, when you look at the result, we get the following.
Why in the heck is that gross profit number not right? It seems we’ve got very simple math we’re dealing with here, what could be the problem? Many folks at this point go for the simple solution – just select show opposite sign on the gross profit $ line.
Unfortunately, this doesn’t work either, because you are flipping the sign on both the revenue value as well as the cost of sales value and you simply get the opposite of the same wrong number you got above.
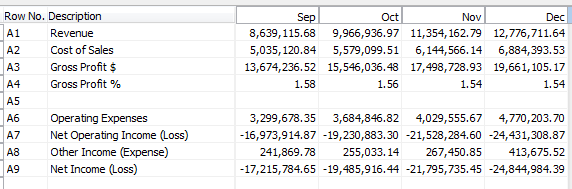
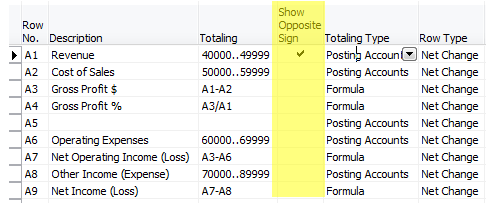
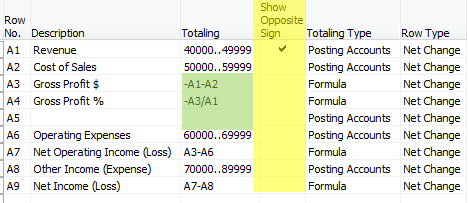
The reason this is happening is because the show opposite sign function is doing exactly what it says it is doing, it is SHOWING the opposite sign. This is really only a presentational mask, and when calculations are done against the value, revenue is still calculating as a negative number, even though it appears on your report as a positive number. This little bit of arithmetic defying programming can make an accountant a little cranky, but it is easy to solve with a little mathematic trickery. In order to fix this, we need to put into place a two part solution. The first part we already know; we must select show opposite sign for our revenue accounts. The second part manipulates the Gross Profit $ and Gross Profit % as shown below, changing the value of the revenue account within the equation in order to calculate correctly.
The end result gets us correct results every time.
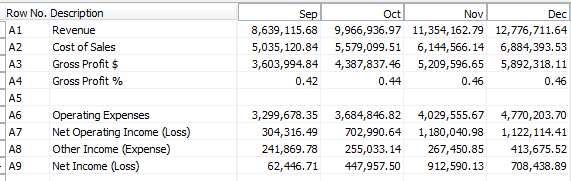
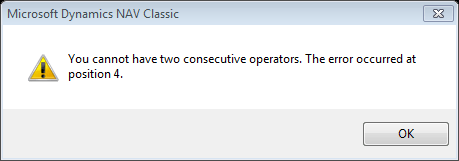
For those of you who are really paying attention, there is one more math mystery in the show opposite sign puzzle. Why have I chosen to show the calculation for Gross Profit % as -A3/A1 instead of simply using A3/-A1? Again, we’ve got to defy the programming with math tricks. Choosing A3/-A1 gives the error shown below. Get around it by moving the negative value to the other side of the equation and you’re good to go.
This posting is part of the NAV Account Schedules 101 series. Find the entire list of lessons here.
Don’t forget to visit the Account Schedule Formulas and Account Schedule Examples pages if you’re looking for even more ideas on how to improve your financial reporting using account schedules with Microsoft Dynamics NAV.
")

