Blogiversary Top 20 (#3) Basic column layout options for NAV Account Schedules
Posted: April 25, 2013 Filed under: Uncategorized | Tags: Account Schedules, balance at date, Classic Client, column layout, comparison date formula, comparison period formula, financial statement, fiscal year, general ledger, NAV, net change, RTC Leave a commentWe’re celebrating our one year blogiversary by reposting the Top 20 Most Viewed in the last year, as determined by you, our readers! Follow this link to see the entire list. Enjoy!
Column layouts in NAV account schedules are what you build to add more flexibility to your financial statements. You can have an unlimited number of column layouts to match together with your already existing row setups. In general, most basic row setups contain general ledger numbers and column layouts contain dates. As an example, when I produce my income statement, I will have one row setup that reflects a summarized income statement and at least four different column layouts that reflect different configurations of month to date, year to date, comparisons against budget, and twelve month trended views.
Just like with row setups, there are many available options in the column layouts. This large variety of options can sometimes be overwhelming to the new account schedule user. I’ll show you which columns to choose in the column layouts for account schedules as a beginning point, and go through some simple explanations of how they are used.
Fields to start with:
Column No. – The column number is completely optional, but highly recommended. This simple element of the column layout will eventually be one of the key features of your account schedule, allowing you to calculate and organize with ease.
Column Header – This is where you’ll define, in words, what you’re showing in each column of your report. Keep it short; there is a 30 character limit.
Column Type: Net Change, Balance at Date, or Formula – There are actually seven options to choose from here, but I recommend that you limit yourself to these three when you’re just getting started. The key here is knowing what type of accounts you’re reporting on. If you’re using income statement accounts (Revenue/Expense), then you need to use net change. If you’re using balance sheet accounts (Assets/Liabilities), then you need to use Balance at Date. Formula allows you to perform calculations in a column.
Ledger Entry Type – This column will allow you to define what type of ledger entries you will show. This is where you can choose actual general ledger entries or budgeted general ledger entries.
Formula – If you’ve chosen Formula as the Column Type, this is where you’ll put the formula.
Comparison Period Formula – This column allows you to define date formulas that are used to calculate the amounts shown. I generally recommend that beginning account schedule users start out using the comparison period formula field instead of the comparison date formula field. The comparison period formula field references the accounting periods set up in the fiscal year, so this option seems the most consistent, and is especially necessary for companies that may not follow a calendar fiscal year. Common data labels used in this field are CP for current period or -1CP for previous period and FY for fiscal year or -1FY for prior year.
Shown below are both the design view and the user view of a column layout for a summarized income statement showing year to date and prior year to date information in the columns to demonstrate the use of these six basic options in an account schedule.
Role Tailored Client


Classic Client


For more information on row setups, please see these posts: Basic row setup options for NAV Account Schedules and Complete row setup options for NAV account schedules.
If you’re just beginning to use account schedules, see Getting started with a new account schedule.
Blogiversary Top 20 (#11) Complete row setup options for NAV account schedules
Posted: April 15, 2013 Filed under: Uncategorized | Tags: Account Schedules, balance at date, Classic Client, column layout, dimensions, Excel, export to excel, financial statement, general ledger, NAV, net change, posting accounts, row setup, RTC, set base for percent, setup options, show opposite sign, totaling type, trial balance Leave a commentWe’re celebrating our one year blogiversary by reposting the Top 20 Most Viewed in the last year, as determined by you, our readers! Follow this link to see the entire list. Enjoy!
About a month ago, I published a post called Basic row setup options for NAV account schedules. This is a great place to look if you’re just getting started. However, if you’re looking for what else you can do with Microsoft Dynamics NAV account schedules, then this is where you want to be. This post will go through each and every field available on the account schedule row setup and talk about the available options. The functionality of these fields are exactly the same between the Classic and Role Tailored Clients. The only difference is in how they look on the screen and how you navigate between screens. Take a look at the pictures below to find the look you’re familiar with, but then keep reading for the explanations of what these fields will do in your financial reporting.
Role Tailored Client
This is a view of what I recommend you start with for basic row setup options.

This is a view of all available row setup options.

Classic Client
This is a view of what I recommend you start with for basic row setup options.

This is a view of all available row setup options.

Row setup options – apply to both clients
Row No. is completely optional, but highly recommended. This simple element of the row setup will eventually be one of the key features of your account schedule, allowing you to calculate and organize with ease.
Description is the one place you have to communicate, in words, what you’re showing on each line of your report.
Totaling Type: 6 options to choose from
- Posting Accounts pull data from your accounts designated as posting accounts on the G/L Account Card Account Type field.
- Total Accounts pull data from your accounts designated as a total or as an end-total on the G/L Account Card Account Type field.
- Formula allows you to calculate a basic formula on this row.
- Underline places a single underline .
- Double Underline places a double underline.
- NOTE: This nifty addition showed up with NAV 2009 R2. If you are NAV 2009 SP1 or earlier, this won’t be available to you.
- Both of the underline functions are there to give folks who print account schedules directly out of NAV some formatting options. If you’re exporting to Excel you’ve got some better format options to work with than these.
- Set Base for Percent allows you to designate which row from your row setup will be used as the beginning point for a section to be included in a percent of total calculation. This feature showed up in version 5.0 and must be used together with a formula on another row to designate the end point of the section as well as some setup in the column layout. It’s a little fussy in the setup and inelegant in execution, but is still effective to get those vital comparative percentages onto your account schedules.
Totaling will be which general ledger accounts you want to pull or what formula you want to calculate, depending on what you selected in totaling type.
Row Type: 3 options to choose from
- Net Change should be used, generally, if you’re reporting on income statement accounts (revenue/expense).
- Balance at Date should be used, generally, if you’re reporting on balance sheet accounts (assets/liabilities).
- Beginning Balance will be sparingly used, but you’ll want this for your statement of cash flows at some point.
Amount Type gives you three options: Net Amount, Debit Amount and Credit Amount. You’re going to use Net Amount almost all the time, but I suppose if you were getting very granular in your account schedules and perhaps using them for detailed reconciling reports, this might be useful. If I’m getting down to this level of transactional detail, I’m usually going to the chart of accounts instead of account schedules.
Formatting Fields: Bold, Italic, and Underline These basic formatting fields are there to allow you to emphasize some of the rows of your account schedules. When you select these options on any row, the whole row is effected. You are not able to effect a single “cell” for formatting. What’s the difference between underline here and underline found in the Totaling Type options? You can get a more snug fit on your underline using this option since it appears in the same row of your data instead of in a row if its own.
New Page inserts a page break. This is commonly used when separating the pages of the balance sheet showing assets on the first page and liabilities and equity on the second page. I have also seen it used when folks build multi page account schedules.
Show Opposite Sign is the option you can select to change revenue credit balances or expense debit balances to the opposite sign for the purposes of presenting this data in a more non-finance friendly manner. No salesperson wants to see sales presented with a negative sign; use this to change that credit to a positive number on your reporting.
Show allows you to designate if a row will show (the default) or be hidden on the printed account schedule only. You can click this box as much as you want, but your rows will still show on-screen or when you export to Excel. If you print directly out of account schedules, this feature will work very well for you.
Dimension Totaling is the last option available and you might have noticed that I didn’t show them on pictures above. This is because they are unique for just about every user, and depending on your analysis view setup, may even be different from schedule to schedule. You can use just one, or you can use all four of the available dimension totaling fields, in whatever combination you like. These fields act very much like the Totaling field because this is where you will tell NAV what Dimensions you want shown and totaled from your general ledger accounts.
Blogiversary Top 20 (#13) Basic row setup options for NAV Account Schedules
Posted: April 11, 2013 Filed under: Uncategorized | Tags: Account Schedules, balance at date, Classic Client, financial statement, net change, row setup, RTC, totaling type Leave a commentWe’re celebrating our one year blogiversary by reposting the Top 20 Most Viewed in the last year, as determined by you, our readers! Follow this link to see the entire list. Enjoy!
The perpetual problem of the new NAV user is when you get started in a new area of the application, there are way too many options to choose from. How many times have you opened up a new form, only to find twenty or more columns displayed as the default, and many more lurking behind the show columns menu? While we appreciate having all options for all people at some point, new users can find this especially daunting when trying to just get started with something new.
I’ll show you which columns to choose in the row setup for account schedules as a beginning point, and go through some simple explanations of how they are used.
Fields to start with:
Row No. – The row number is completely optional, but highly recommended. This simple element of the row setup will eventually be one of the key features of your account schedule, allowing you to calculate and organize with ease.
Description – This is the one place you have to communicate, in words, what you’re showing on each line of your report.
Totaling Type: Posting Accounts or Formula – This field tells NAV what you’re going to do here. You’re either going to pull data from your general ledger posting accounts or calculate a formula.
Totaling – Which general ledger accounts you want to pull or what formula you want to calculate.
Row Type: Net Change or Balance at Date – The key here is knowing what type of accounts you’re reporting on. If you’re using income statement accounts (Revenue/Expense), then you need to use net change. If you’re using balance sheet accounts (assets/liabilities), then you need to use Balance at Date.
Shown below are both the design view and the user view of a summarized income statement, showing the use of these five options.
Role Tailored Client


Classic Client


Blogiversary Top 20 (#14) Video Demo: How to export NAV account schedules to Microsoft Excel
Posted: April 10, 2013 Filed under: Uncategorized | Tags: Account Schedules, dimensions, Excel, export to excel, financial statement, learning, NAV, NAVUG, NAVUG Academy, training Leave a commentWe’re celebrating our one year blogiversary by reposting the Top 20 Most Viewed in the last year, as determined by you, our readers! Follow this link to see the entire list. Enjoy!
There are some quick and easy ways to publish NAV Account Schedules to Microsoft Excel but some of them end up with some pretty ugly formatting unless you know a few secrets on how to make them look better. This short demo video shows you how to create a nicely formatted NAV Account Schedule in Microsoft Excel that only requires formatting the first time you set it up. Each time you replicate the report after that, you can simply update the report with new numbers and the formatting will remain the same every time.
While this demo shows how to create a financial report with three monthly tabs, you can easily extend this technique in a couple of different ways. I use this same technique to produce my monthly financial statement package. I have eighteen pages in the package I produce each month, and each page is a different account schedule. When I start a new month, I copy the Excel workbook and rename it with the new month, then use exactly this same technique to produce the new month’s reports. By using this technique, the new copied workbook acts as a “shell” to receive my new numbers. From month to month, I am able to maintain consistent formatting in my reporting while producing my financial reports in the most efficient way possible. I can apply the same principles to my monthly team budget reports. In this case, I can produce the same actual versus budget report over and over with a new dimension filter applied for each team, one per each Excel worksheet in the workbook.
If you’d like to learn more about account schedules, please visit my 2013 Classes page. This short video demo comes from my Account Schedules Basics class which I teach through NAVUG Academy. This class offering is just one of many classes that are being offered by NAVUG Academy in 2013 to help you get more out of your use of NAV at your company.
Blogiversary Top 20 (#20) Use show opposite sign to reflect net income correctly on an income statement using NAV account schedules
Posted: April 2, 2013 Filed under: Uncategorized | Tags: Account Schedules, financial statement, income statement, net income, show opposite sign, tips and tricks Leave a commentWe’re celebrating our one year blogiversary by reposting the Top 20 Most Viewed in the last year, as determined by you, our readers! Follow this link to see the entire list. Enjoy!
One of the concepts I see students in my NAV account schedules class get stuck on is exactly how to use the show opposite sign function when constructing an income statement. It can be a bit mysterious why it behaves the way it does, and it seems to defy the rules of accounting and basic arithmetic all at the same time. Once you understand why it works the way it does, you’ll know how to use it in the future. From the example shown here, we see a very basic income statement.

Without using any numbers yet, let’s all agree on some basic calculations:
Revenue – Cost of Sales = Gross Profit $
Gross Profit $ / Revenue = Gross Profit %
Gross Profit $ – Operating Expenses = Net Operating Income (Loss)
Putting these basic calculations into the design view for this account schedule gives the result below. Notice we’re not going to use the show opposite sign function yet, or make any changes to the basic formulas we just defined.

When we look at the report view for this account schedule we see that we’ve got a significantly wrong result. The revenue is showing as a negative number and all of the calculations below it are incorrect.

Now, for the accountants out there, you may already have guessed what the problem is. When accounting for revenue, these numbers are assigned a credit value, which shows up as a negative. Most financial statement end users want to see this reflected as a positive number. This is where we need to use show opposite sign. Let’s add that in to the design view, as shown below.

When we look at our new result, you would think all would be correct. We’ve corrected the accounting problem by flipping the sign. However, when you look at the result, we get the following.

Why in the heck is that gross profit number not right? It seems we’ve got very simple math we’re dealing with here, what could be the problem? Many folks at this point go for the simple solution – just select show opposite sign on the gross profit $ line.

Unfortunately, this doesn’t work either, because you are flipping the sign on both the revenue value as well as the cost of sales value and you simply get the opposite of the same wrong number you got above.

The reason this is happening is because the show opposite sign function is doing exactly what it says it is doing, it is SHOWING the opposite sign. This is really only a presentational mask, and when calculations are done against the value, revenue is still calculating as a negative number, even though it appears on your report as a positive number. This little bit of arithmetic defying programming can make an accountant a little cranky, but it is easy to solve with a little mathematic trickery. In order to fix this, we need to put into place a two part solution. The first part we already know; we must select show opposite sign for our revenue accounts. The second part manipulates the Gross Profit $ and Gross Profit % as shown below, changing the value of the revenue account within the equation in order to calculate correctly.

The end result gets us correct results every time.

For those of you who are really paying attention, there is one more math mystery in the show opposite sign puzzle. Why have I chosen to show the calculation for Gross Profit % as -A3/A1 instead of simply using A3/-A1? Again, we’ve got to defy the programming with math tricks. Choosing A3/-A1 gives the error shown below. Get around it by moving the negative value to the other side of the equation and you’re good to go.

DynamicsNAVFinancials blog celebrates one year with top 20 postings
Posted: April 1, 2013 Filed under: Uncategorized | Tags: Account Schedules, budgets, Classic Client, Convergence, dimensions, Dynamics, Excel, export to excel, financial reporting, financial statement, general ledger, NAV, NAV 2013, NAVUG, payment terms, PowerPivot, tips and tricks, user group 2 Comments It’s our blogiversary! I started this blog in April 0f 2012, inspired by the number of NAV end users I had met over the last year who had the same questions that just weren’t getting answered. What better way to get that information out to folks than a blog where I could write up the topic in an easy to understand way?
You’ve shown your support! Over that last year, we’ve had over 15,000 views, almost 100 followers via email, have people following us on our new Facebook page, and know that many of you follow postings through the RSS feed. People from more than 120 countries are reading DynamicsNAVFinancials! The blog has gotten enough attention to be picked up for syndication through Microsoft Dynamics Community and I was even asked to participate as one of the eleven official bloggers at Microsoft Dynamics Convergence 2013 last month.
Special thanks has got to go to the NAVUG. The user group has been especially supportive of me and of the blog, finding opportunities for me to speak to NAV users in person, in webinars, online classes, and through this blog. Without the support of the user group this would have been a much longer road and I am so grateful for the constant work they have done to get me in front of as many readers as possible.
Publishing over an entry a week in the last year, there’s a lot to choose from, but in the month of April, I’ll be re-running the top 20 postings determined by the most viewed entries. Enjoy, and thank you so much for reading! There would be no reason to do this without you!
19 The NAV accountant’s little helper: the reconciliation account check box
18 Learning about Microsoft Dynamics NAV 2013: on demand learning from NAVUG is a fantastic resource!
17 Tis the (Budget) Season! Three handy NAV account schedule tips to get you through
16 Tips and tricks for a flawless budget load in NAV
15 Why NAV users should be using dual monitors
14 Video Demo: How to export NAV account schedules to Microsoft Excel
13 Basic row setup options for NAV Account Schedules
12 Aging methods in NAV – which buckets are you looking for?
11 Complete row setup options for NAV account schedules
10 Learning about Microsoft Dynamics NAV 2013
9 Where can I learn more about NAV analysis reports and analysis by dimensions?
8 10 easy tips for payment terms success in Microsoft Dynamics NAV
6 Getting started with a new account schedule
4 Maximize your Microsoft Dynamics NAV 2009 Classic screen space with user level configuration options
3 Basic column layout options for NAV Account Schedules
2 NAV keyboard shortcuts – Classic to RTC
1 The Account Schedules Formulas Page
Add NAV dimensions as your business changes (part 14 of 15)
Posted: March 28, 2013 Filed under: Uncategorized | Tags: dimensions, financial reporting, financial statement, global, NAV, shortcut Leave a comment Setting up dimensions should not be something we exclusively do when we implement NAV for the first time at our businesses. Change is the norm in business, and I would be genuinely surprised to hear from anyone at this point that their business has not changed significantly in the last five years. So for finance and IT professionals, what changes when the business changes? Reporting requirements!
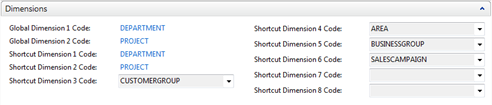
For NAV, that means opportunity for using dimensions differently or to add new dimensions. Hopefully you are happy with your global dimensions, the two most important dimensions for your company, and you’re ready to add some shortcut dimensions so you can expand your reporting capabilities. There are four main things you should keep in mind when adding a shortcut dimension.
1) Keep in mind timing and financial cutoff. If you choose to start collecting data on a new dimension today and today falls in the middle of a fiscal period, you’re going to create a disconnect in your financial data where you have data with the new dimension value and data with the blank dimension value in the same period. Don’t do it. Find out when the end of the fiscal period is, and start gathering the new data starting with the start of the new fiscal period. This doesn’t have to be the year-end, it could be a month, or whatever period you have at your company, but do take the time to plan this out, your finance department will thank you later.
2) Know that collecting a new dimension will not magically attach to your historic data. Assigning dimension data to your item or customer or vendor only begins the collection of that data on any new transactions generated since you assigned the dimension data. There is nothing out there that will magically attach this new requirement to old historic data. There are ways to go back and change the historic data, but this is generally beyond what you want to do manually. Involve someone experienced in SQL or call your partner for some help with this. And for goodness sakes, try this in a test system first. It’s always good to do a practice run on this kind of change, and should be mandatory if you’re planning to change a large amount of data. Remember that in many cases, it is perfectly ok to collect new data without catching up the history. Only you can decide what you need for your reporting.
3) Don’t abandon your pending data. Don’t forget there are things out there you created prior to assigning that new shortcut dimension. Sales orders, purchase orders, transfer orders and any other type of form that may be in process at the time you defined that new dimension will need to be caught up to the new requirements. If you forget this, NAV will remind you by throwing a dimension error when you, or your colleagues, try to post those documents to the system.
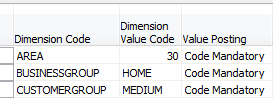
4) Consistency is the key. Make sure you set up this new dimension with the same level of consistency you’ve used with your other dimensions. Start with your master data, but follow through by adding the safety net of the chart of accounts, and remember to incorporate your choice of value postings.
Keep reading this month as we continue our series, 15 Days of NAV Dimensions.
Communicating to IT about NAV dimensions and NAV2013 dimension sets (part 13 of 15)
Posted: March 27, 2013 Filed under: Uncategorized | Tags: Account Schedules, default dimensions, dimension sets, dimensions, financial reporting, financial statement, NAV, NAV 2013 Leave a commentToday I’ve got some old news and some new news for you regarding dimensions, but first I need to re-emphasize that finance and IT must be of one mind when it comes to dimensions. As a finance professional, you’ll definitely have your perspective on how dimensions will help you to efficiently produce financial reports with control and consistency. But remember that finance and IT need to work in partnership on a NAV dimension strategy in order to be really successful. One way these two roles must work together is regarding how to get your hands on posted dimension data in NAV. If you’re using NAV only tools to get your data, you won’t need this information, but once you progress to using outside reporting tool packages, you need to know a little bit more to get your collective hands on that data.
 Here’s the old news: if you are using any version of NAV prior to NAV2013, dimensions are kept in a separate table behind your main data. You can see this, though it may not be obvious to you, when you populate dimensions using Ctrl-Alt-D or when you view dimensions through the dimensions button from master data. This table is actually called the default dimensions table (table #352). If you’re using something like SQL for reporting, you’ll need to perform a join between this table and the table(s) to which the data are related. As of today, the large majority of NAV users are using versions prior to NAV2013, so this is important information to have if you’re to get all the data you want into your reports now.
Here’s the new news: With NAV2013, dimension sets are turning dimensions upside down, treating them in an entirely different way, in order to make the way dimensions are stored in NAV more efficient. We’ve all heard the horror stories of ginormous databases with performance problems due to overuse of dimensions. Those stories have always been frustrating to me because it seems we should be able to use dimensions in as robust a manner as we can handle. Well, Microsoft has made a great improvement with the creation of dimension sets. I’ll admit that explaining the mechanics of exactly how dimension sets work is beyond my technical capability, so I’ll hand that off to experts more talented than I. I did get to see a presentation by Jesper Lachance where he showed an example (which he allowed me to share in my recent Dimensions presentation at Microsoft Dynamics Convergence 2013) that shows a twenty fold decrease in number of data items stored by using dimension sets instead of the pre-NAV2013 method.
Faithie Robertson of Archerpoint has a fantastic article A Better Mousetrap! Dimension Sets in Dynamics NAV 2013 (Navision) which does a really great job of explaining exactly what a dimension set does differently.
If you’re looking for a textbook explanation, visit MSDN on their page Dimension Set Entries Overview.
Encore Business Solutions has an illustrated guide NAV 2013 – Dimension Sets.
You can see why, with dimensions being stored in a separate table, and with dimension sets showing up as a new improvement, everybody on the team needs to understand how dimensions work, where they’re kept, what your particular company conventions are, and how you’ll report against them accurately and effectively. I haven’t heard a lot of feedback yet from end users about how working with dimension sets is working for them and whether it is making reporting better or challenging in different ways. But, the feedback from programmers, developers, and database administrators has been a resounding: THANK YOU MICROSOFT!!!
Keep reading this month as we continue our series, 15 Days of NAV Dimensions.
NAV dimensions in budgets and consolidations (part 12 of 15)
Posted: March 26, 2013 Filed under: Uncategorized | Tags: Account Schedules, budgets, Classic Client, consolidation, dimensions, financial reporting, financial statement, global, NAV, shortcut Leave a commentNow that you know you can view dimensions on postings and in financial reporting though account schedules, let me show you how you can utilize dimensions in budgets. NAV budgets opens up a few more possibilities for you where dimensions are concerned. Take a look at this screen shot, using the classic client, that shows clearly what the available dimensions are in budgets.
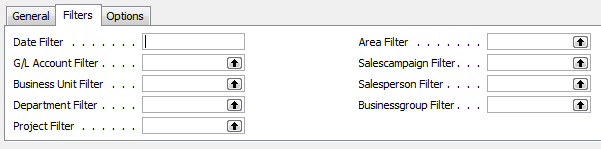 If you look at the left side, you can see the persistent global dimensions of Department and Project which the test database for Cronus uses. Just like all areas of NAV, global dimensions are available everywhere, even in budgets. On the right hand side, you can actually see four more dimensions. These are shortcut dimensions and if you count, you can see you’ve got a total of six dimensions available with NAV budgets to use for your planning process. As long as you budget for a dimension then you can report actual versus budgeted against that dimension.
In addition, you can also see there is a field called business unit filter, which I’ve always counted on as a “bonus” dimension. This field becomes useful when you have multiple companies in NAV and use them to consolidate your financial statements. I’ve got a very simple setup where I have two companies and a consolidation company. When I consolidate my statements monthly, and when I load my budgets, I designate the business unit filter for each of the two companies so I can report on them individually as well as together, on a consolidated level. Because I use separate companies with the business unit filter I don’t need to use a dimension to designate company for my financial statements.
Keep reading this month as we continue our series, 15 Days of NAV Dimensions.
Viewing NAV dimensions on postings: where can you see them? (part 5 of 15)
Posted: March 15, 2013 Filed under: Uncategorized | Tags: dimensions, Dynamics, financial statement, global, NAV, shortcut Leave a commentInevitably, once you’ve dipped your toe into the world of dimensions, the next thing you’re going to want to know about is the difference between global and shortcut dimensions.
 Global dimensions are the two most important dimensions you can choose because global dimensions are the most accessible from anywhere in NAV. They are posted with every transaction you have attached them to, right along side the data, and you can see them on every form as an available choice without having to do anything special. You can see them right along with all your other data in forms (like a sales order or purchase invoice), in journals, in posted history, and global dimensions are even available for selection in every canned NAV report.
A common misconception about global dimensions is that they must be department and project. This simply isn’t so, and in my opinion, is an old holdover from thousands and thousands of NAV demos that use the CRONUS database, where the globals they have used as their demo example are department and project.
The global dimensions your company chooses should be the two most important things your company needs to report on when looking at your financial data. If your company is very customer-centric, maybe one of those globals should be customer related. As an example, if your company groups their customers by wholesale or retail, and uses this designation as a major reporting category when looking at your sales each month (or each day!), you may want to choose this “customergroup” as one of your global dimensions.
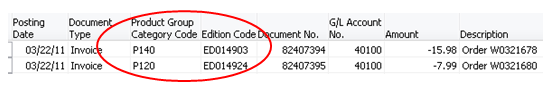
If your company is very inventory-centric, maybe one of those globals should be item related. My company has a large number of SKUS, so we find it absolutely essential to relate our global dimensions to our inventory items in order to make sense out of our sales data. We’ve designated a global dimension called PGC or product group category to allow us to group our large list of items into smaller groupings that are easier to digest when we produce reports. In addition, we also use a global dimension called edition that has a one to one relationship with each item we sell. With these two global dimensions, we can look at our sales by large group of items as well as item by item. This comes in mighty handy when it’s time to evaluate gross margin. We can get a macro and a micro view of what’s going on with our gross margin without having to do a lot of digging into the data.
You may have an even different emphasis on what your company needs to monitor. I’ve seen lots of companies who depend heavily on their dimension reporting to allow them to monitor what is going on per salesperson or territory or region. Spend a good amount of time talking this over with your company stakeholders. What really matters? What should you be looking at? Remember too, that just because you are reporting on one measure right now doesn’t mean it’s the right measure to be reporting on in the future. Figure out what those two most important things are, and designate them as your global dimensions.
Shortcut dimensions are what you’ll begin to use once you realize that two dimensions simply aren’t enough! The single largest limitation to shortcut dimensions is that they are not as readily available as global dimensions. They do not have those two designated always there fields that the globals hold. Technically, you can have an unlimited number of dimensions in total, but shortcut dimensions are special because they are more reachable. By designating a dimension as a shortcut dimension, you are making that dimension available as a choice on your forms ((like a sales order or purchase invoice), in journals, in posted history, and in every canned NAV report. The trick is that they don’t show up automatically, and you’ll need to go to the show column area on your forms and purposefully choose them for use the first time.
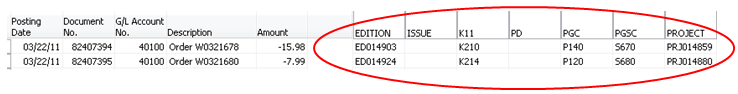
When you’re looking at posted history, you’ll need to use a new trick to see shortcut dimensions. As an example, choose some transactions from your chart of accounts. You’ll be on the general ledger entry table. Now choose entry and g/l dimension overview. You’ll now get a view that looks like what I’ve pasted below, showing all your shortcut dimensions as well as the global dimensions.
Another perspective on shortcut dimensions is one of efficiency. You will always want to set up a dimension as a shortcut if your end users need to access the field in order to enter or change data on a regular basis. An example of this from my company is our shortcut dimension, team. For all expense accounts, we designate a team in order to track who incurred that expense. My accounts payable person must enter that information for every expense related invoice because the computer simply can’t be trained to make all the decisions she must make in order to determine whose team gets the expense. Team is a shortcut dimension for us because she can set that field up on every form she uses so it is available for her to use for data entry right on the form, keeping her from having to go anywhere else to enter that information.
Keep reading this month as we continue our series, 15 Days of NAV Dimensions.
")

