Blogiversary Top 20 (#9) Where can I learn more about NAV analysis reports and analysis by dimensions?
Posted: April 17, 2013 Filed under: Uncategorized | Tags: analysis by dimensions, Analysis Reports, CustomerSource, export to excel, general ledger, item ledger entries, NAV, pivot table, query tool, reporting tool Leave a commentWe’re celebrating our one year blogiversary by reposting the Top 20 Most Viewed in the last year, as determined by you, our readers! Follow this link to see the entire list. Enjoy!
Analysis reports and analysis by dimensions are the native reporting options that extend NAV reporting to the item ledger entries generated from the sales, purchasing, and inventory areas of the application. I find that many users don’t know that this reporting option exists and think it is one of the more underutilized areas by NAV financial users.
These reporting options can be found on the general ledger, sales & marketing, purchasing, and inventory menus.
The main advantage this reporting tool has over account schedules is that it reaches a further level of detail that just isn’t recorded on the general ledger. Being able to get to quantity information at the item or location level in addition to the dollar values posted makes these tools great as a way to get operational reporting.
What is the difference between the two?
Analysis by dimensions is a query tool. The key to using this tool effectively is to use aggressive filtering, especially if you have a large number of items. It can be a very quick way to get information about what may be going on with a single or small group of items. You can also export to Excel and it shows up in a pivot table.
Analysis Reports allow you to configure and save row setups and column layouts for later use, which makes it a reporting tool. These reports work a lot like account schedules, with some added features to accommodate the additional data you can reach because you’re reporting against the item ledger entry tables instead of the general ledger.
A few hints on analysis reports and analysis by dimensions:
- Skip the analysis report on the general ledger menu and use accounts schedules; you’re not going to get any added value here.
- When posting sales or purchase orders, you must be fully utilizing the sub module, i.e. do not allow any posting of lines to general ledger accounts on the sales or purchase order documents. Any posting that goes “around” these modules will cause your analysis report to show a lower number than what is on your general ledger. Avoid the argument of reporting credibility by understanding this, and either being able to explain the variance, or prevent it from happening altogether.
- Know that analysis reports will not automatically update if you add new items. You’ll need to go in and do this manually to each report every time you add new items.
For those of you who are looking for more resources on Analysis by Dimension and Analysis Views, reference the documents below, found on Customer Source:
Documentation => User Guides => Overview of Training Manuals and Hands-On Labs for Microsoft Dynamics NAV 2009
- Trade in Microsoft Dynamics NAV 2009 – Chapter 9
- Business Intelligence for Information Workers in Microsoft Dynamics NAV 2009 – Chapter 5
Documentation => User Guides => Overview of Training Manuals for Microsoft Dynamics NAV 5.0
- Trade in Microsoft Dynamics NAV 5.0 – Chapter 10
- Business Intelligence for Information Workers in Microsoft Dynamics NAV 5.0 – Chapter 6
Blogiversary Top 20 (#11) Complete row setup options for NAV account schedules
Posted: April 15, 2013 Filed under: Uncategorized | Tags: Account Schedules, balance at date, Classic Client, column layout, dimensions, Excel, export to excel, financial statement, general ledger, NAV, net change, posting accounts, row setup, RTC, set base for percent, setup options, show opposite sign, totaling type, trial balance Leave a commentWe’re celebrating our one year blogiversary by reposting the Top 20 Most Viewed in the last year, as determined by you, our readers! Follow this link to see the entire list. Enjoy!
About a month ago, I published a post called Basic row setup options for NAV account schedules. This is a great place to look if you’re just getting started. However, if you’re looking for what else you can do with Microsoft Dynamics NAV account schedules, then this is where you want to be. This post will go through each and every field available on the account schedule row setup and talk about the available options. The functionality of these fields are exactly the same between the Classic and Role Tailored Clients. The only difference is in how they look on the screen and how you navigate between screens. Take a look at the pictures below to find the look you’re familiar with, but then keep reading for the explanations of what these fields will do in your financial reporting.
Role Tailored Client
This is a view of what I recommend you start with for basic row setup options.

This is a view of all available row setup options.

Classic Client
This is a view of what I recommend you start with for basic row setup options.

This is a view of all available row setup options.

Row setup options – apply to both clients
Row No. is completely optional, but highly recommended. This simple element of the row setup will eventually be one of the key features of your account schedule, allowing you to calculate and organize with ease.
Description is the one place you have to communicate, in words, what you’re showing on each line of your report.
Totaling Type: 6 options to choose from
- Posting Accounts pull data from your accounts designated as posting accounts on the G/L Account Card Account Type field.
- Total Accounts pull data from your accounts designated as a total or as an end-total on the G/L Account Card Account Type field.
- Formula allows you to calculate a basic formula on this row.
- Underline places a single underline .
- Double Underline places a double underline.
- NOTE: This nifty addition showed up with NAV 2009 R2. If you are NAV 2009 SP1 or earlier, this won’t be available to you.
- Both of the underline functions are there to give folks who print account schedules directly out of NAV some formatting options. If you’re exporting to Excel you’ve got some better format options to work with than these.
- Set Base for Percent allows you to designate which row from your row setup will be used as the beginning point for a section to be included in a percent of total calculation. This feature showed up in version 5.0 and must be used together with a formula on another row to designate the end point of the section as well as some setup in the column layout. It’s a little fussy in the setup and inelegant in execution, but is still effective to get those vital comparative percentages onto your account schedules.
Totaling will be which general ledger accounts you want to pull or what formula you want to calculate, depending on what you selected in totaling type.
Row Type: 3 options to choose from
- Net Change should be used, generally, if you’re reporting on income statement accounts (revenue/expense).
- Balance at Date should be used, generally, if you’re reporting on balance sheet accounts (assets/liabilities).
- Beginning Balance will be sparingly used, but you’ll want this for your statement of cash flows at some point.
Amount Type gives you three options: Net Amount, Debit Amount and Credit Amount. You’re going to use Net Amount almost all the time, but I suppose if you were getting very granular in your account schedules and perhaps using them for detailed reconciling reports, this might be useful. If I’m getting down to this level of transactional detail, I’m usually going to the chart of accounts instead of account schedules.
Formatting Fields: Bold, Italic, and Underline These basic formatting fields are there to allow you to emphasize some of the rows of your account schedules. When you select these options on any row, the whole row is effected. You are not able to effect a single “cell” for formatting. What’s the difference between underline here and underline found in the Totaling Type options? You can get a more snug fit on your underline using this option since it appears in the same row of your data instead of in a row if its own.
New Page inserts a page break. This is commonly used when separating the pages of the balance sheet showing assets on the first page and liabilities and equity on the second page. I have also seen it used when folks build multi page account schedules.
Show Opposite Sign is the option you can select to change revenue credit balances or expense debit balances to the opposite sign for the purposes of presenting this data in a more non-finance friendly manner. No salesperson wants to see sales presented with a negative sign; use this to change that credit to a positive number on your reporting.
Show allows you to designate if a row will show (the default) or be hidden on the printed account schedule only. You can click this box as much as you want, but your rows will still show on-screen or when you export to Excel. If you print directly out of account schedules, this feature will work very well for you.
Dimension Totaling is the last option available and you might have noticed that I didn’t show them on pictures above. This is because they are unique for just about every user, and depending on your analysis view setup, may even be different from schedule to schedule. You can use just one, or you can use all four of the available dimension totaling fields, in whatever combination you like. These fields act very much like the Totaling field because this is where you will tell NAV what Dimensions you want shown and totaled from your general ledger accounts.
Blogiversary Top 20 (#14) Video Demo: How to export NAV account schedules to Microsoft Excel
Posted: April 10, 2013 Filed under: Uncategorized | Tags: Account Schedules, dimensions, Excel, export to excel, financial statement, learning, NAV, NAVUG, NAVUG Academy, training Leave a commentWe’re celebrating our one year blogiversary by reposting the Top 20 Most Viewed in the last year, as determined by you, our readers! Follow this link to see the entire list. Enjoy!
There are some quick and easy ways to publish NAV Account Schedules to Microsoft Excel but some of them end up with some pretty ugly formatting unless you know a few secrets on how to make them look better. This short demo video shows you how to create a nicely formatted NAV Account Schedule in Microsoft Excel that only requires formatting the first time you set it up. Each time you replicate the report after that, you can simply update the report with new numbers and the formatting will remain the same every time.
While this demo shows how to create a financial report with three monthly tabs, you can easily extend this technique in a couple of different ways. I use this same technique to produce my monthly financial statement package. I have eighteen pages in the package I produce each month, and each page is a different account schedule. When I start a new month, I copy the Excel workbook and rename it with the new month, then use exactly this same technique to produce the new month’s reports. By using this technique, the new copied workbook acts as a “shell” to receive my new numbers. From month to month, I am able to maintain consistent formatting in my reporting while producing my financial reports in the most efficient way possible. I can apply the same principles to my monthly team budget reports. In this case, I can produce the same actual versus budget report over and over with a new dimension filter applied for each team, one per each Excel worksheet in the workbook.
If you’d like to learn more about account schedules, please visit my 2013 Classes page. This short video demo comes from my Account Schedules Basics class which I teach through NAVUG Academy. This class offering is just one of many classes that are being offered by NAVUG Academy in 2013 to help you get more out of your use of NAV at your company.
Blogiversary Top 20 (#16) Tips and tricks for a flawless budget load in NAV
Posted: April 8, 2013 Filed under: Uncategorized | Tags: budgets, Excel, export to excel, NAV, tips and tricks Leave a commentWe’re celebrating our one year blogiversary by reposting the Top 20 Most Viewed in the last year, as determined by you, our readers! Follow this link to see the entire list. Enjoy!
Hopefully, you’ve completed your budget work for 2013 and all you need to do to finish is to load all that information to NAV so you can begin to report against your actual financial numbers. If you’ve done this before, you might already know that NAV’s budget tool can be a bit fussy and also a bit cryptic about why it won’t accept your carefully prepared data. Here are four quick tips to help you with getting that data into NAV quickly, correctly, and in one try.
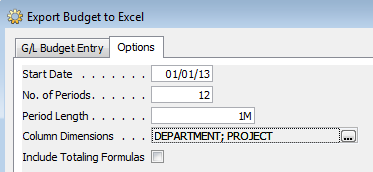
1. Export first, then import. This is the single most important detail about getting budget data loaded into NAV. You can choose to export an existing budget or even choose to export a blank new budget. Exporting a budget as your first step establishes a working template you can populate your data into, including dimensions. As long as you start with this template, you are already most of the way there to a successful NAV budget load.
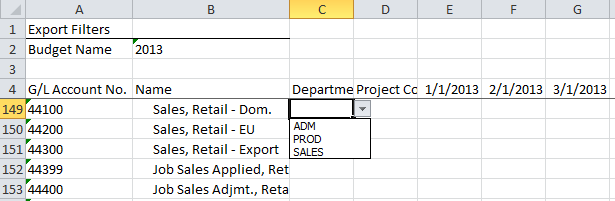
2. If you’re using dimensions, validate your data against the provided drop downs. Make sure all budget lines that use dimensions are only using valid dimension names. Any deviation from the allowable values that already exist in NAV can cause your budget load to error out or load without balancing.
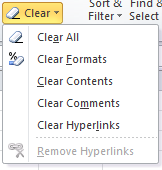
3. Clear the formats from your numbers. Once you’ve copied and pasted or typed your numbers into your Excel template, use the Excel “Clear Formats” function on all cells that contain a numeric value to make sure they are all returned to a formatted status of general. NAV does not accept any other format than the one in the template, and use of other formats, including use of commas in the numbers, will cause the budget tool to give an error and keep you from loading your budget successfully.
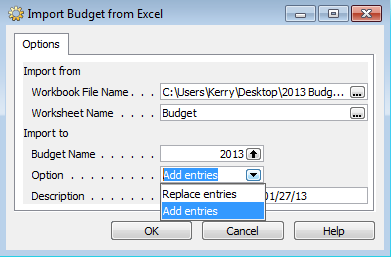
4. Use the “Add Entries” option for a brand new budget load and the “Replace Entries” option for a subsequent version. The add entries option should only be used for a brand new budget load, otherwise the entries will be added on top of the already existing entries, doubling or tripling them. If you need to load a second or third version or some type of correction, always use the replace entries option instead of the add entries option. If you really get stuck with a bunch of errors, the best thing you can do is delete your budget and reload from scratch.
Take one last look through your data to make sure it’s accurate and exactly what you expected. You can use the budget tool to do this, or even better, put together a quick account schedule that shows your entries using “G/L Budget Entries” instead of “G/L Entries”. Make sure to look at your total balances, balances by fiscal period, and balances with dimension filters applied. Once you’re satisfied that all your budgeted data has loaded correctly and completely, you’re ready to produce financial reporting showing actual versus budgeted numbers!
DynamicsNAVFinancials blog celebrates one year with top 20 postings
Posted: April 1, 2013 Filed under: Uncategorized | Tags: Account Schedules, budgets, Classic Client, Convergence, dimensions, Dynamics, Excel, export to excel, financial reporting, financial statement, general ledger, NAV, NAV 2013, NAVUG, payment terms, PowerPivot, tips and tricks, user group 2 Comments It’s our blogiversary! I started this blog in April 0f 2012, inspired by the number of NAV end users I had met over the last year who had the same questions that just weren’t getting answered. What better way to get that information out to folks than a blog where I could write up the topic in an easy to understand way?
You’ve shown your support! Over that last year, we’ve had over 15,000 views, almost 100 followers via email, have people following us on our new Facebook page, and know that many of you follow postings through the RSS feed. People from more than 120 countries are reading DynamicsNAVFinancials! The blog has gotten enough attention to be picked up for syndication through Microsoft Dynamics Community and I was even asked to participate as one of the eleven official bloggers at Microsoft Dynamics Convergence 2013 last month.
Special thanks has got to go to the NAVUG. The user group has been especially supportive of me and of the blog, finding opportunities for me to speak to NAV users in person, in webinars, online classes, and through this blog. Without the support of the user group this would have been a much longer road and I am so grateful for the constant work they have done to get me in front of as many readers as possible.
Publishing over an entry a week in the last year, there’s a lot to choose from, but in the month of April, I’ll be re-running the top 20 postings determined by the most viewed entries. Enjoy, and thank you so much for reading! There would be no reason to do this without you!
19 The NAV accountant’s little helper: the reconciliation account check box
18 Learning about Microsoft Dynamics NAV 2013: on demand learning from NAVUG is a fantastic resource!
17 Tis the (Budget) Season! Three handy NAV account schedule tips to get you through
16 Tips and tricks for a flawless budget load in NAV
15 Why NAV users should be using dual monitors
14 Video Demo: How to export NAV account schedules to Microsoft Excel
13 Basic row setup options for NAV Account Schedules
12 Aging methods in NAV – which buckets are you looking for?
11 Complete row setup options for NAV account schedules
10 Learning about Microsoft Dynamics NAV 2013
9 Where can I learn more about NAV analysis reports and analysis by dimensions?
8 10 easy tips for payment terms success in Microsoft Dynamics NAV
6 Getting started with a new account schedule
4 Maximize your Microsoft Dynamics NAV 2009 Classic screen space with user level configuration options
3 Basic column layout options for NAV Account Schedules
2 NAV keyboard shortcuts – Classic to RTC
1 The Account Schedules Formulas Page
Video Demo: How to export NAV account schedules to Microsoft Excel
Posted: February 5, 2013 Filed under: Uncategorized | Tags: Account Schedules, dimensions, Excel, export to excel, financial statement, learning, NAVUG, NAVUG Academy, training Leave a commentThere are some quick and easy ways to publish NAV Account Schedules to Microsoft Excel but some of them end up with some pretty ugly formatting unless you know a few secrets on how to make them look better. This short demo video shows you how to create a nicely formatted NAV Account Schedule in Microsoft Excel that only requires formatting the first time you set it up. Each time you replicate the report after that, you can simply update the report with new numbers and the formatting will remain the same every time.
While this demo shows how to create a financial report with three monthly tabs, you can easily extend this technique in a couple of different ways. I use this same technique to produce my monthly financial statement package. I have eighteen pages in the package I produce each month, and each page is a different account schedule. When I start a new month, I copy the Excel workbook and rename it with the new month, then use exactly this same technique to produce the new month’s reports. By using this technique, the new copied workbook acts as a “shell” to receive my new numbers. From month to month, I am able to maintain consistent formatting in my reporting while producing my financial reports in the most efficient way possible. I can apply the same principles to my monthly team budget reports. In this case, I can produce the same actual versus budget report over and over with a new dimension filter applied for each team, one per each Excel worksheet in the workbook.
If you’d like to learn more about account schedules, please visit my 2013 Classes page. This short video demo comes from my Account Schedules Basics class which I teach through NAVUG Academy. This class offering is just one of many classes that are being offered by NAVUG Academy in 2013 to help you get more out of your use of NAV at your company.
This posting is one of the Top 20 Most Viewed in the last year! Follow this link to see the entire list.
Tips and tricks for a flawless budget load in NAV
Posted: January 21, 2013 Filed under: Uncategorized | Tags: budgets, Excel, export to excel, NAV, tips and tricks 1 CommentHopefully, you’ve completed your budget work for 2013 and all you need to do to finish is to load all that information to NAV so you can begin to report against your actual financial numbers. If you’ve done this before, you might already know that NAV’s budget tool can be a bit fussy and also a bit cryptic about why it won’t accept your carefully prepared data. Here are four quick tips to help you with getting that data into NAV quickly, correctly, and in one try.
1. Export first, then import. This is the single most important detail about getting budget data loaded into NAV. You can choose to export an existing budget or even choose to export a blank new budget. Exporting a budget as your first step establishes a working template you can populate your data into, including dimensions. As long as you start with this template, you are already most of the way there to a successful NAV budget load.
2. If you’re using dimensions, validate your data against the provided drop downs. Make sure all budget lines that use dimensions are only using valid dimension names. Any deviation from the allowable values that already exist in NAV can cause your budget load to error out or load without balancing.
3. Clear the formats from your numbers. Once you’ve copied and pasted or typed your numbers into your Excel template, use the Excel “Clear Formats” function on all cells that contain a numeric value to make sure they are all returned to a formatted status of general. NAV does not accept any other format than the one in the template, and use of other formats, including use of commas in the numbers, will cause the budget tool to give an error and keep you from loading your budget successfully.
4. Use the “Add Entries” option for a brand new budget load and the “Replace Entries” option for a subsequent version. The add entries option should only be used for a brand new budget load, otherwise the entries will be added on top of the already existing entries, doubling or tripling them. If you need to load a second or third version or some type of correction, always use the replace entries option instead of the add entries option. If you really get stuck with a bunch of errors, the best thing you can do is delete your budget and reload from scratch.
Take one last look through your data to make sure it’s accurate and exactly what you expected. You can use the budget tool to do this, or even better, put together a quick account schedule that shows your entries using “G/L Budget Entries” instead of “G/L Entries”. Make sure to look at your total balances, balances by fiscal period, and balances with dimension filters applied. Once you’re satisfied that all your budgeted data has loaded correctly and completely, you’re ready to produce financial reporting showing actual versus budgeted numbers!
This posting is one of the Top 20 Most Viewed in the last year! Follow this link to see the entire list.
Complete row setup options for NAV account schedules
Posted: July 30, 2012 Filed under: Uncategorized | Tags: Account Schedules, balance at date, Classic Client, column layout, dimensions, Excel, export to excel, financial statement, general ledger, microsoft dynamics nav, NAV, net change, posting accounts, row setup, RTC, set base for percent, setup options, show opposite sign, totaling type, trial balance 1 CommentAbout a month ago, I published a post called Basic row setup options for NAV account schedules. This is a great place to look if you’re just getting started. However, if you’re looking for what else you can do with Microsoft Dynamics NAV account schedules, then this is where you want to be. This post will go through each and every field available on the account schedule row setup and talk about the available options. The functionality of these fields are exactly the same between the Classic and Role Tailored Clients. The only difference is in how they look on the screen and how you navigate between screens. Take a look at the pictures below to find the look you’re familiar with, but then keep reading for the explanations of what these fields will do in your financial reporting.
Role Tailored Client
This is a view of what I recommend you start with for basic row setup options.
This is a view of all available row setup options.
Classic Client
This is a view of what I recommend you start with for basic row setup options.
This is a view of all available row setup options.
Row setup options – apply to both clients
Row No. is completely optional, but highly recommended. This simple element of the row setup will eventually be one of the key features of your account schedule, allowing you to calculate and organize with ease.
Description is the one place you have to communicate, in words, what you’re showing on each line of your report.
Totaling Type: 6 options to choose from
- Posting Accounts pull data from your accounts designated as posting accounts on the G/L Account Card Account Type field.
- Total Accounts pull data from your accounts designated as a total or as an end-total on the G/L Account Card Account Type field.
- Formula allows you to calculate a basic formula on this row.
- Underline places a single underline .
- Double Underline places a double underline.
- NOTE: This nifty addition showed up with NAV 2009 R2. If you are NAV 2009 SP1 or earlier, this won’t be available to you.
- Both of the underline functions are there to give folks who print account schedules directly out of NAV some formatting options. If you’re exporting to Excel you’ve got some better format options to work with than these.
- Set Base for Percent allows you to designate which row from your row setup will be used as the beginning point for a section to be included in a percent of total calculation. This feature showed up in version 5.0 and must be used together with a formula on another row to designate the end point of the section as well as some setup in the column layout. It’s a little fussy in the setup and inelegant in execution, but is still effective to get those vital comparative percentages onto your account schedules.
Totaling will be which general ledger accounts you want to pull or what formula you want to calculate, depending on what you selected in totaling type.
Row Type: 3 options to choose from
- Net Change should be used, generally, if you’re reporting on income statement accounts (revenue/expense).
- Balance at Date should be used, generally, if you’re reporting on balance sheet accounts (assets/liabilities).
- Beginning Balance will be sparingly used, but you’ll want this for your statement of cash flows at some point.
Amount Type gives you three options: Net Amount, Debit Amount and Credit Amount. You’re going to use Net Amount almost all the time, but I suppose if you were getting very granular in your account schedules and perhaps using them for detailed reconciling reports, this might be useful. If I’m getting down to this level of transactional detail, I’m usually going to the chart of accounts instead of account schedules.
Formatting Fields: Bold, Italic, and Underline These basic formatting fields are there to allow you to emphasize some of the rows of your account schedules. When you select these options on any row, the whole row is effected. You are not able to effect a single “cell” for formatting. What’s the difference between underline here and underline found in the Totaling Type options? You can get a more snug fit on your underline using this option since it appears in the same row of your data instead of in a row if its own.
New Page inserts a page break. This is commonly used when separating the pages of the balance sheet showing assets on the first page and liabilities and equity on the second page. I have also seen it used when folks build multi page account schedules.
Show Opposite Sign is the option you can select to change revenue credit balances or expense debit balances to the opposite sign for the purposes of presenting this data in a more non-finance friendly manner. No salesperson wants to see sales presented with a negative sign; use this to change that credit to a positive number on your reporting.
Show allows you to designate if a row will show (the default) or be hidden on the printed account schedule only. You can click this box as much as you want, but your rows will still show on-screen or when you export to Excel. If you print directly out of account schedules, this feature will work very well for you.
Dimension Totaling is the last option available and you might have noticed that I didn’t show them on pictures above. This is because they are unique for just about every user, and depending on your analysis view setup, may even be different from schedule to schedule. You can use just one, or you can use all four of the available dimension totaling fields, in whatever combination you like. These fields act very much like the Totaling field because this is where you will tell NAV what Dimensions you want shown and totaled from your general ledger accounts.
This posting is one of the Top 20 Most Viewed in the last year! Follow this link to see the entire list.
Where can I learn more about NAV analysis reports and analysis by dimensions?
Posted: July 9, 2012 Filed under: Uncategorized | Tags: analysis by dimensions, Analysis Reports, CustomerSource, export to excel, general ledger, item ledger entries, NAV, pivot table, query tool, reporting tool 1 CommentAnalysis reports and analysis by dimensions are the native reporting options that extend NAV reporting to the item ledger entries generated from the sales, purchasing, and inventory areas of the application. I find that many users don’t know that this reporting option exists and think it is one of the more underutilized areas by NAV financial users.
These reporting options can be found on the general ledger, sales & marketing, purchasing, and inventory menus.
The main advantage this reporting tool has over account schedules is that it reaches a further level of detail that just isn’t recorded on the general ledger. Being able to get to quantity information at the item or location level in addition to the dollar values posted makes these tools great as a way to get operational reporting.
What is the difference between the two?
Analysis by dimensions is a query tool. The key to using this tool effectively is to use aggressive filtering, especially if you have a large number of items. It can be a very quick way to get information about what may be going on with a single or small group of items. You can also export to Excel and it shows up in a pivot table.
Analysis Reports allow you to configure and save row setups and column layouts for later use, which makes it a reporting tool. These reports work a lot like account schedules, with some added features to accommodate the additional data you can reach because you’re reporting against the item ledger entry tables instead of the general ledger.
A few hints on analysis reports and analysis by dimensions:
- Skip the analysis report on the general ledger menu and use accounts schedules; you’re not going to get any added value here.
- When posting sales or purchase orders, you must be fully utilizing the sub module, i.e. do not allow any posting of lines to general ledger accounts on the sales or purchase order documents. Any posting that goes “around” these modules will cause your analysis report to show a lower number than what is on your general ledger. Avoid the argument of reporting credibility by understanding this, and either being able to explain the variance, or prevent it from happening altogether.
- Know that analysis reports will not automatically update if you add new items. You’ll need to go in and do this manually to each report every time you add new items.
For those of you who are looking for more resources on Analysis by Dimension and Analysis Views, reference the documents below, found on Customer Source:
Documentation => User Guides => Overview of Training Manuals and Hands-On Labs for Microsoft Dynamics NAV 2009
- Trade in Microsoft Dynamics NAV 2009 – Chapter 9
- Business Intelligence for Information Workers in Microsoft Dynamics NAV 2009 – Chapter 5
Documentation => User Guides => Overview of Training Manuals for Microsoft Dynamics NAV 5.0
- Trade in Microsoft Dynamics NAV 5.0 – Chapter 10
- Business Intelligence for Information Workers in Microsoft Dynamics NAV 5.0 – Chapter 6
This posting is one of the Top 20 Most Viewed in the last year! Follow this link to see the entire list.
Use insert accounts for a fast start on building a trial balance
Posted: June 11, 2012 Filed under: Uncategorized | Tags: Account Schedules, Classic Client, export to excel, general ledger, insert accounts, NAV, row setup, RTC, trial balance Leave a commentYou’re diving into using account schedules – you’ve figured out where they are, created a brand new one, given it an easy short name and a longer descriptive name and now you’re ready to get started. Now what? You need to begin with the row setup; the foundation of all account schedules.
The row setup defines what you’ll see on the lines of your report. Generally you’ll want to define general ledger accounts, or groups of general ledger accounts, in the row setup when you’re just getting started. Later, you’ll want to add some column layouts but let’s focus on getting that foundation built first.
The easiest way to get going with a new row setup is to put together a trial balance. Your trial balance should be a listing of all your general ledger accounts, one line each, which will show the balance of each account on a particular date, generally a month or period end. If you add them all up, all the accounts should balance to zero, which is one way to prove that your books are in balance.
Role Tailored Client Instructions
If you’re using the role-tailored client (RTC), choose Edit Account Schedule from the action pane.

You’ll get a new screen with many blank rows ready to be used. From this screen, choose Actions=>Functions=>Insert Accounts.

This opens up your G/L Account List. Use your mouse to select all the rows you want to add to your row setup.

Once you’ve highlighted them all (they should turn light blue), hit OK, and all the accounts you’ve selected will be added to your row setup, one row per account.

At this point, don’t make any changes to the row setup. Let’s see if it matches the canned trial balance that you can print directly out of NAV. Choose the Overview button (shown in the above screenshot). Select a column layout. If you don’t have one yet, hang in there, we’ll cover that in an upcoming post. For now, I’m going to choose a simple one that shows balance only. Select Show Matrix from the action pane.

This will show all the accounts you selected in your row setup, now in your account schedule.

To prove out the balance, dump the account schedule into Excel. Do this by choosing Actions=>Functions=>Export to Excel. On the next window choose the option to Create a New Workbook. Hit OK, and your schedule will export to Excel. Watch out: If you’ve used Begin or End-Total lines in your chart of accounts, you’ll need to remove these lines. These are calculated fields, and should not be a part of your trial balance.


Let’s run the canned trial balance from NAV as a comparison to see if we’ve done this right. Follow this trail to get to the report: Departments=>Financial Management=>General Ledger=>Reports=>Financial Statement=>Trial Balance. Select Actual Balances as your report column and make sure the date filter is set to the same date you used when running the account schedule. Compare the report to the account schedule. Each line should match between the two reports and the total should be zero on both, proving your trial balance is indeed in balance.
Classic Client Instructions
For those who use the classic client, let’s run through the same steps. Starting from Financial Management=>General Ledger=>Analysis & Reporting=>Account Schedules, choose your new account schedule from the list.

Hit OK, and you’ll get a new screen with many blank rows ready to be used. From the Functions button on the bottom right, choose Insert Accounts.

This opens up your G/L Account List. Simply click on the blank cell immediately to the left of the No. field to select all accounts quickly.

Once you’ve highlighted them all (they should turn dark blue), hit OK, and all the accounts you’ve selected will be added to your row setup, one row per account.
At this point, don’t make any changes to the row setup. Let’s see if it matches the canned trial balance that you can print directly out of NAV. Hit OK, and then choose Overview from the Account Schedules button found on the bottom right.

Select a column layout from the Column Layout Name field. If you don’t have one yet, hang in there, we’ll cover that in an upcoming post. For now, I’m going to choose a simple one that shows balance only.

This will show all the accounts you selected in your row setup, now in your account schedule.
To prove out the balance, dump the account schedule into Excel. Do this by choosing Export to Excel from the Functions button on the bottom right.

On the next window choose the option to Create a New Workbook. Hit OK and your schedule will export to Excel. Watch out: If you’ve used Begin or End-Total lines in your chart of accounts, you’ll need to remove these lines. These are calculated fields, and should not be a part of your trial balance.

Let’s run the canned trial balance from NAV as a comparison to see if we’ve done this right. Follow this trail to get to the report: Financial Management=>General Ledger=>Reports=>Financial Statement=>Trial Balance. On the Options tab, select Actual Balances as your report column and make sure the date filter is set to the same date you used when running the account schedule. Compare the report to the account schedule. Each line should match between the two reports and the total should be zero on both, proving your trial balance is indeed in balance.
")

