Blogiversary Top 20 (#20) Use show opposite sign to reflect net income correctly on an income statement using NAV account schedules
Posted: April 2, 2013 Filed under: Uncategorized | Tags: Account Schedules, financial statement, income statement, net income, show opposite sign, tips and tricks Leave a commentWe’re celebrating our one year blogiversary by reposting the Top 20 Most Viewed in the last year, as determined by you, our readers! Follow this link to see the entire list. Enjoy!
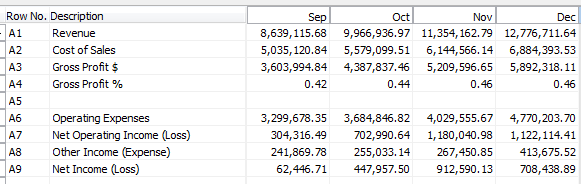
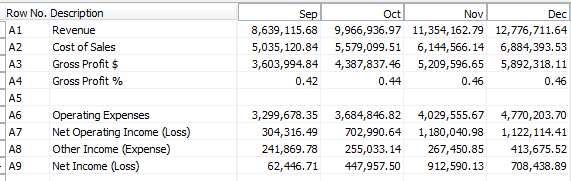
One of the concepts I see students in my NAV account schedules class get stuck on is exactly how to use the show opposite sign function when constructing an income statement. It can be a bit mysterious why it behaves the way it does, and it seems to defy the rules of accounting and basic arithmetic all at the same time. Once you understand why it works the way it does, you’ll know how to use it in the future. From the example shown here, we see a very basic income statement.

Without using any numbers yet, let’s all agree on some basic calculations:
Revenue – Cost of Sales = Gross Profit $
Gross Profit $ / Revenue = Gross Profit %
Gross Profit $ – Operating Expenses = Net Operating Income (Loss)
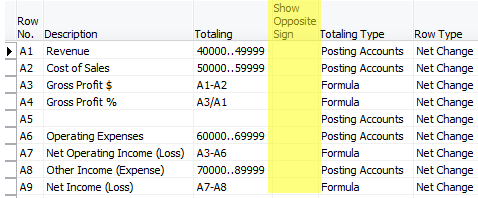
Putting these basic calculations into the design view for this account schedule gives the result below. Notice we’re not going to use the show opposite sign function yet, or make any changes to the basic formulas we just defined.

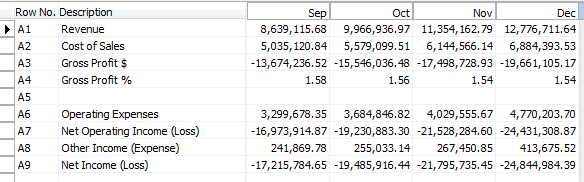
When we look at the report view for this account schedule we see that we’ve got a significantly wrong result. The revenue is showing as a negative number and all of the calculations below it are incorrect.

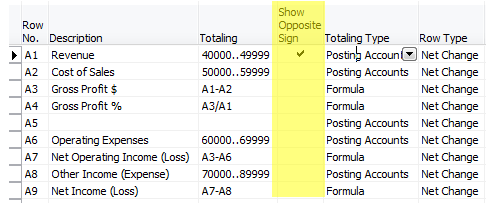
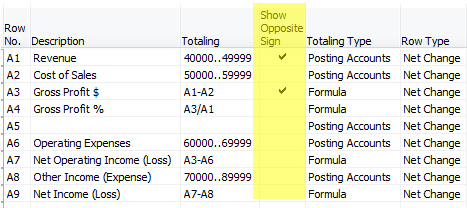
Now, for the accountants out there, you may already have guessed what the problem is. When accounting for revenue, these numbers are assigned a credit value, which shows up as a negative. Most financial statement end users want to see this reflected as a positive number. This is where we need to use show opposite sign. Let’s add that in to the design view, as shown below.

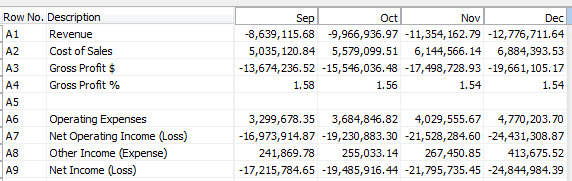
When we look at our new result, you would think all would be correct. We’ve corrected the accounting problem by flipping the sign. However, when you look at the result, we get the following.

Why in the heck is that gross profit number not right? It seems we’ve got very simple math we’re dealing with here, what could be the problem? Many folks at this point go for the simple solution – just select show opposite sign on the gross profit $ line.

Unfortunately, this doesn’t work either, because you are flipping the sign on both the revenue value as well as the cost of sales value and you simply get the opposite of the same wrong number you got above.

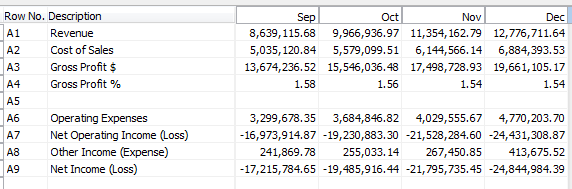
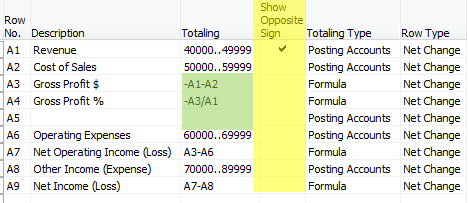
The reason this is happening is because the show opposite sign function is doing exactly what it says it is doing, it is SHOWING the opposite sign. This is really only a presentational mask, and when calculations are done against the value, revenue is still calculating as a negative number, even though it appears on your report as a positive number. This little bit of arithmetic defying programming can make an accountant a little cranky, but it is easy to solve with a little mathematic trickery. In order to fix this, we need to put into place a two part solution. The first part we already know; we must select show opposite sign for our revenue accounts. The second part manipulates the Gross Profit $ and Gross Profit % as shown below, changing the value of the revenue account within the equation in order to calculate correctly.

The end result gets us correct results every time.

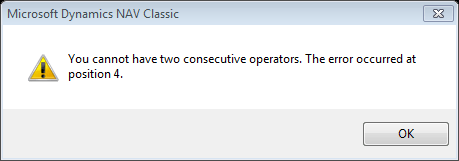
For those of you who are really paying attention, there is one more math mystery in the show opposite sign puzzle. Why have I chosen to show the calculation for Gross Profit % as -A3/A1 instead of simply using A3/-A1? Again, we’ve got to defy the programming with math tricks. Choosing A3/-A1 gives the error shown below. Get around it by moving the negative value to the other side of the equation and you’re good to go.

Use show opposite sign to reflect net income correctly on an income statement using NAV account schedules
Posted: December 11, 2012 Filed under: Uncategorized | Tags: Account Schedules, accounting, financial statement, income statement, net income, show opposite sign, tips and tricks, two consecutive operators Leave a commentOne of the concepts I see students in my NAV account schedules class get stuck on is exactly how to use the show opposite sign function when constructing an income statement. It can be a bit mysterious why it behaves the way it does, and it seems to defy the rules of accounting and basic arithmetic all at the same time. Once you understand why it works the way it does, you’ll know how to use it in the future. From the example shown here, we see a very basic income statement.
Without using any numbers yet, let’s all agree on some basic calculations:
Revenue – Cost of Sales = Gross Profit $
Gross Profit $ / Revenue = Gross Profit %
Gross Profit $ – Operating Expenses = Net Operating Income (Loss)
Putting these basic calculations into the design view for this account schedule gives the result below. Notice we’re not going to use the show opposite sign function yet, or make any changes to the basic formulas we just defined.
When we look at the report view for this account schedule we see that we’ve got a significantly wrong result. The revenue is showing as a negative number and all of the calculations below it are incorrect.
Now, for the accountants out there, you may already have guessed what the problem is. When accounting for revenue, these numbers are assigned a credit value, which shows up as a negative. Most financial statement end users want to see this reflected as a positive number. This is where we need to use show opposite sign. Let’s add that in to the design view, as shown below.
When we look at our new result, you would think all would be correct. We’ve corrected the accounting problem by flipping the sign. However, when you look at the result, we get the following.
Why in the heck is that gross profit number not right? It seems we’ve got very simple math we’re dealing with here, what could be the problem? Many folks at this point go for the simple solution – just select show opposite sign on the gross profit $ line.
Unfortunately, this doesn’t work either, because you are flipping the sign on both the revenue value as well as the cost of sales value and you simply get the opposite of the same wrong number you got above.
The reason this is happening is because the show opposite sign function is doing exactly what it says it is doing, it is SHOWING the opposite sign. This is really only a presentational mask, and when calculations are done against the value, revenue is still calculating as a negative number, even though it appears on your report as a positive number. This little bit of arithmetic defying programming can make an accountant a little cranky, but it is easy to solve with a little mathematic trickery. In order to fix this, we need to put into place a two part solution. The first part we already know; we must select show opposite sign for our revenue accounts. The second part manipulates the Gross Profit $ and Gross Profit % as shown below, changing the value of the revenue account within the equation in order to calculate correctly.
The end result gets us correct results every time.
For those of you who are really paying attention, there is one more math mystery in the show opposite sign puzzle. Why have I chosen to show the calculation for Gross Profit % as -A3/A1 instead of simply using A3/-A1? Again, we’ve got to defy the programming with math tricks. Choosing A3/-A1 gives the error shown below. Get around it by moving the negative value to the other side of the equation and you’re good to go.
This posting is one of the Top 20 Most Viewed in the last year! Follow this link to see the entire list.
")

