Week six recap: Account Schedules 101
Posted: May 23, 2014 Filed under: Uncategorized Leave a comment Here’s the week 6 recap on the NAV Account Schedules 101 series. Follow the links below to view the posts for each of the lessons we covered this week or view the entire series here.
NAV AS 101 Lesson 13: Printing Account Schedules
NAV AS 101 Lesson 14: Exporting to Excel
Don’t forget to visit the Account Schedule Formulas and Account Schedule Examples pages if you’re looking for even more ideas on how to improve your financial reporting using account schedules with Microsoft Dynamics NAV.
NAV AS 101 Lesson 14: Exporting to Excel
Posted: May 22, 2014 Filed under: Uncategorized Leave a commentUsing the Export to Excel function is the single most important time-saver when using NAV account schedules because once you create your first Excel workbook and set all the formatting you’ve created a “shell” that never needs to be set up or changed again. Each month, when you produce your reports for the next fiscal cycle, all you need to do is update that month’s numbers. Not only does this save you a huge amount of time, but your reports also look consistently the same month after month.
This post has video demonstrations showing three different ways to use the export to Excel function. The videos are all done using NAV 2009 R2 Classic, but the functions work exactly the same in all versions of NAV. The only thing that is different is how you get to the Export to Excel function in each version of the software.
NAV 2009 Classic – Choose Functions button at bottom right then choose Export to Excel
NAV2009 RTC – Choose Actions button at top left then choose Functions then choose Export to Excel
NAV2013 – On the Ribbon choose Export to Excel
Produce the same report for three different months
Produce the same report for three different dimensions
Produce financial statement package with three different reports, for two different months
Correction: Oh no! In NAV2013, we’ve lost the ability to update the workbook and still retain formatting. See my post on Account Schedule bugs here for more details on the new recommended best practice on how to deal with this change. I’ll get a new video posted out here with a demo of how to do this later this year.
This posting is part of the NAV Account Schedules 101 series. Find the entire list of lessons here.
Don’t forget to visit the Account Schedule Formulas and Account Schedule Examples pages if you’re looking for even more ideas on how to improve your financial reporting using account schedules with Microsoft Dynamics NAV.
NAV AS 101 Lesson 13: Printing Account Schedules
Posted: May 20, 2014 Filed under: Uncategorized Leave a comment You’ve got a few options to get account schedules out of NAV. You can print them, export them to Microsoft Excel, or you can even simply copy and paste the results out of NAV and into Excel.
I generally recommend companies choose to use the export to Microsoft Excel function because it allows maximum efficiency with maximum flexibility to produce their financial statements. We’ll go over that in the next post in this series.
If you just need a quick dump to Excel so you can play with the numbers a bit, you can simply select all the rows you have on-screen, right-click and copy, and then right-click and paste into Excel. Be warned that you can only copy what’s actually showing on the screen, so if everything is not showing, you’ve got to rearrange your screen a bit to make this work well.
In addition, you can choose to produce your financial reports using XBRL, but I’m not going to consider that an end-user friendly function for the purposes of this post. See your partner to help you get set up if your company wants to do that.
If you must print, here are some tips to help you make those reports look as good as possible. You can print from two different places in NAV. Things are a little bit different between NAV Classic versions and NAV RTC/2013 versions, so I’ll illustrate them all.
[Warning: some of the images in this post get mighty tiny. Click on any picture to bring it up in it’s very own window to save your eyesight. If you’re reading this one on your phone, you’re out of luck, sorry.]
NAV Classic users
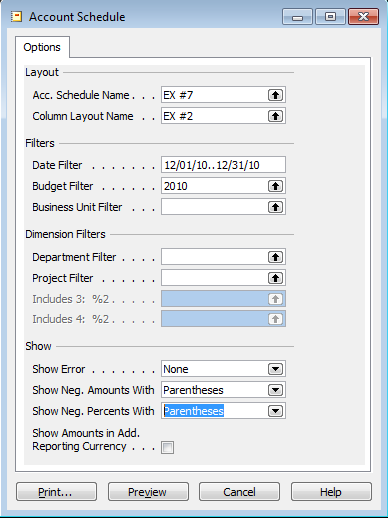
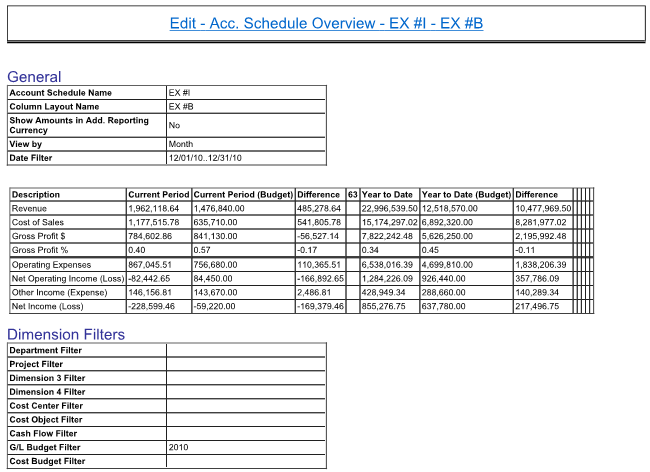
If you elect to print from the account schedules overview screen, choose the function button on the bottom right of the screen and choose Print. This brings up the following configuration screen where you can set a few parameters, and then choose Print.
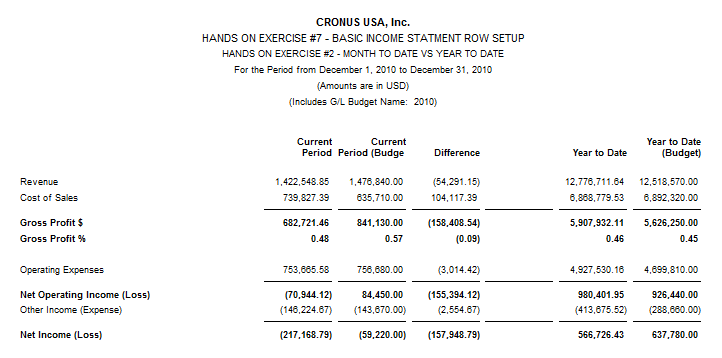
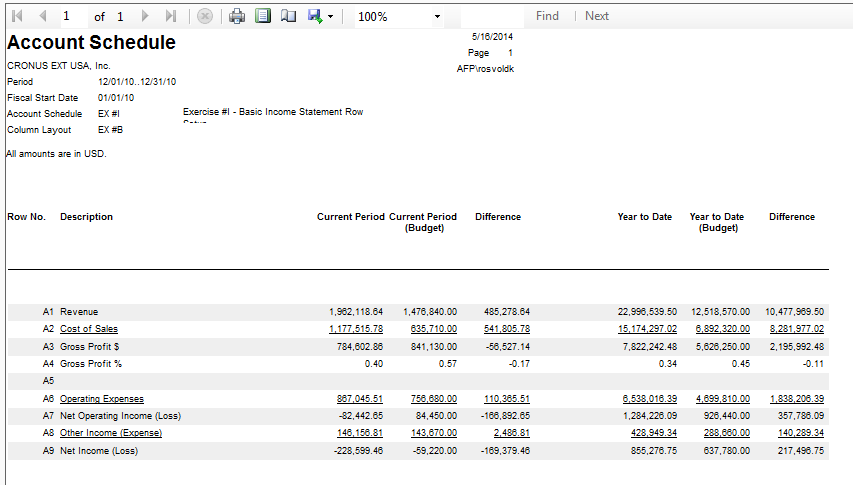
The result you’ll get will look like the screen shot below. There are a few things to note about the result. The information at the top of the page comes from a number of sources. Some of the fields you can control directly, like the row setup and column layout names. In this example, I would want to remove the words “hands on exercise” if I was going to print my schedules. Some of the other fields are coded into the report, so if you want them changed, you’ll need to go into the Object Designer or have your partner change that for you.
The last thing is that the default print setup only allows seven columns, including the description. In this example, I’ve got eight, so my report cuts off the difference column for my year to date numbers. In order to fix that, I can either reduce the number of columns I have, maybe by removing the spacer in the middle, or I can print from a different area.
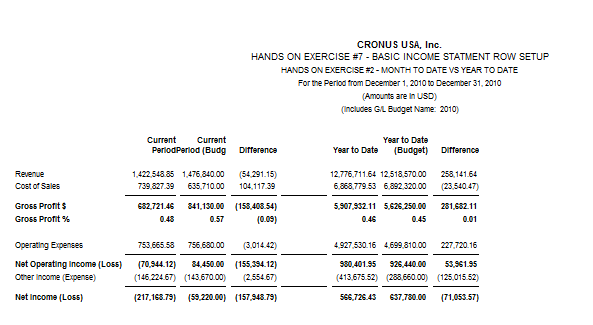
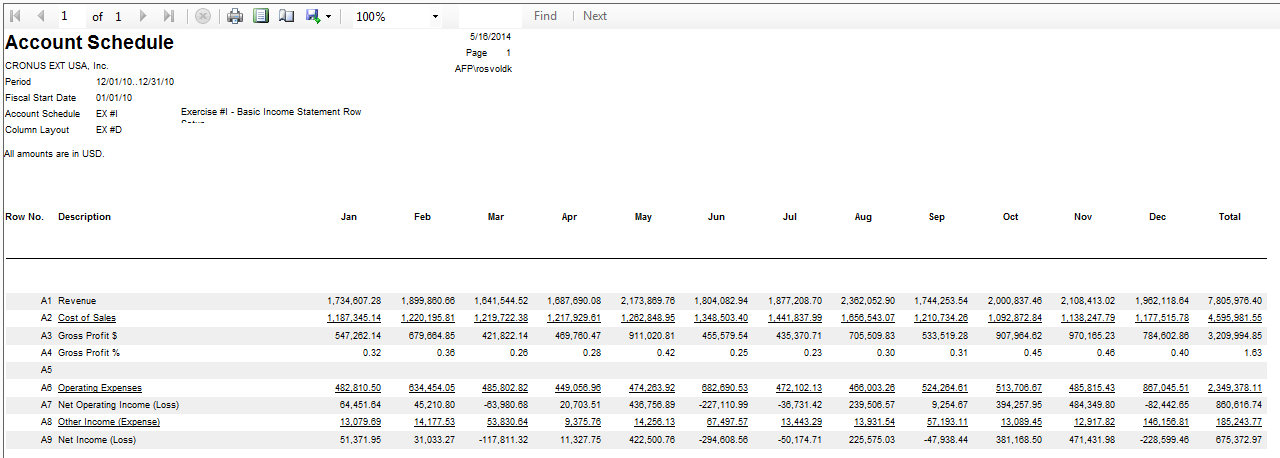
In Classic, go to Financial Management=>General Ledger=>Reports=>Financial Statement=>Account Schedule, Landscape. You’ll see now the report is oriented landscape instead of portrait, so now we can see the difference column that was missing.
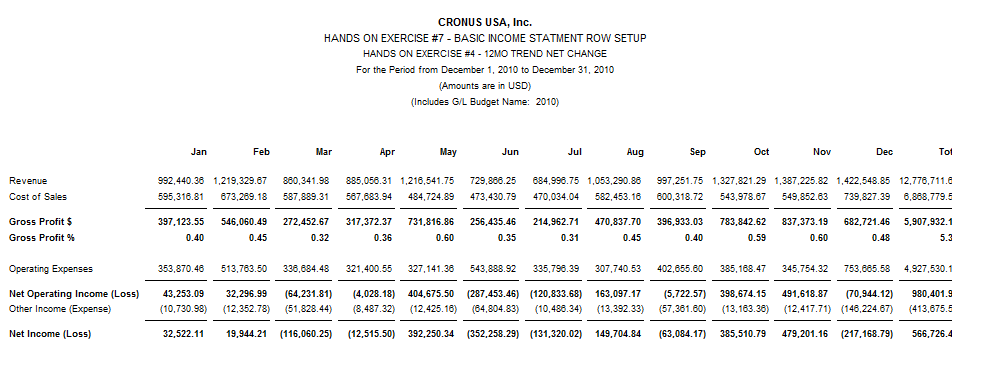
This comes in pretty handy when you’ve got a trended month report to print, which allows 14 columns, including the description, on your report.
NAV Role Tailored Client (RTC) users
The RTC has made a few changes to printing account schedules, but not many. The most notable is printing from the overview looks significantly different. I would consider this as unusable as a financial statement. When you actually print it from the reports menu, it looks exactly the same as the Classic version, shown above, and you still need to choose between the portrait and landscape versions of account schedules.
NAV 2013 users
In NAV2013, we’ve got one huge step forward and a couple small steps back with printing. The huge step forward is that we no longer have to choose between portrait and landscape and, we get the same report when printing whether we print from the overview or from the reports menu. We’ve lost the ability to do some small things, like putting brackets around negative numbers, and now the row numbers show up on the report, which I’m not a thrilled about.
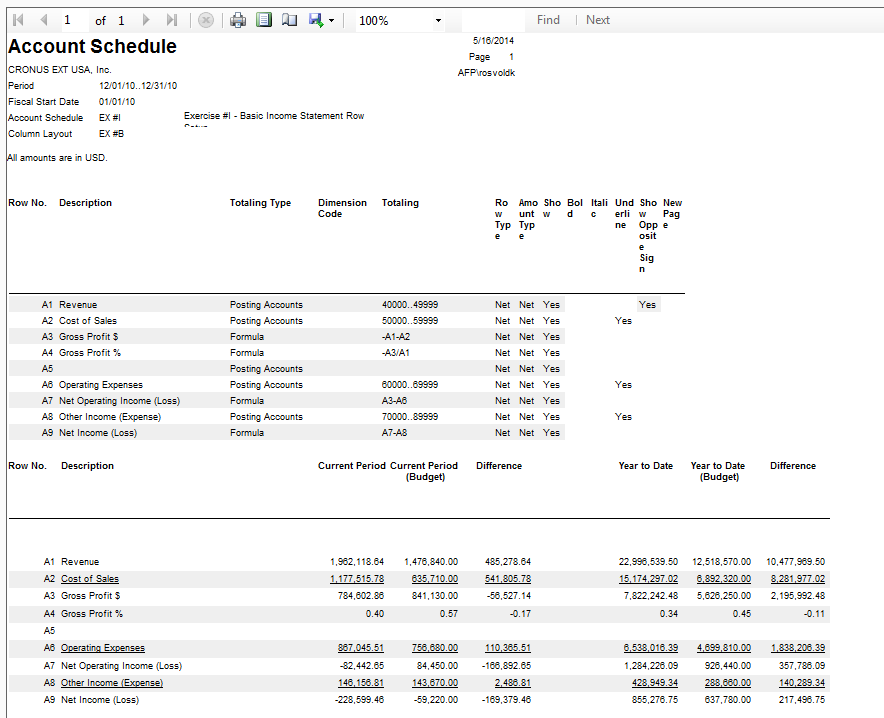
There’s one hidden bonus feature in 2013. If you click a little box in the setup labeled “show account schedule setup”, you get a report that shows your design view right next to your end-user view, which makes it super easy to compare your design and results. We’ve been able to see the layout previously by printing the account schedules layout report, but it’s nice that it’s been added as an option when printing the schedules, all in the same place.
This posting is part of the NAV Account Schedules 101 series. Find the entire list of lessons here.
Don’t forget to visit the Account Schedule Formulas and Account Schedule Examples pages if you’re looking for even more ideas on how to improve your financial reporting using account schedules with Microsoft Dynamics NAV.
Week five recap: Account Schedules 101
Posted: May 16, 2014 Filed under: Uncategorized Leave a commentHere’s the week 5 recap on the NAV Account Schedules 101 series. Follow the links below to view the posts for each of the lessons we covered this week or view the entire series here.
NAV AS 101 Lesson 10: Comparison Period v. Comparison Date
NAV AS 101 Lesson 11: Filtering
NAV AS 101 Lesson 12: Drilling Down
Don’t forget to visit the Account Schedule Formulas and Account Schedule Examples pages if you’re looking for even more ideas on how to improve your financial reporting using account schedules with Microsoft Dynamics NAV.
NAV AS 101 Lesson 12: Drilling Down
Posted: May 16, 2014 Filed under: Uncategorized 2 Comments I don’t know what kind of questions you need to answer as a part of your job, but here are a few of the questions I need to answer in my job every day:
Why is that sales number so low?
Why is that sales number so high?
Where did the expense for “x” end up?
What exactly did that team spend all that money on?
Did we get invoiced for that thing yet?
Did that journal entry get done?
Where did that number come from?
I use account schedules to answer those questions and in most cases, I use the drill down feature to get the answers. Each version of NAV does this a little bit differently, but it’s a very intuitive feature to use no matter what the version.
- CLASSIC: Drill down using the arrow in the cell
- RTC: Right click to drill down
- NAV2013: Double Click to drill down
The mantra you need to learn when using the drill down feature is “drill down to navigate”. In order to get through all the layers of a posting starting with the highly summarized number you see in your account schedule you need to drill down at least a couple of times until you can see the numbers you are looking for. Sometimes you can tell what your answer is by seeing what account or set of accounts the number came from, but other times, you are looking for the entry point of the number – generally either an invoice (sales or purchase) or a journal entry. You can get to all of those juicy answers by drilling down starting from the account schedule, and once you get to the screen that shows you the Navigate function, you can navigate directly to the journal entries that were made and see them in detail or even call up a copy of the invoice you are looking for.
This posting is part of the NAV Account Schedules 101 series. Find the entire list of lessons here.
Don’t forget to visit the Account Schedule Formulas and Account Schedule Examples pages if you’re looking for even more ideas on how to improve your financial reporting using account schedules with Microsoft Dynamics NAV.
NAV AS 101 Lesson 11: Filtering
Posted: May 15, 2014 Filed under: Uncategorized Leave a commentThe primary difference between account schedules in Classic versions of NAV (NAV2009 and prior) and Role Tailored versions of NAV (NAV2009 and later) is mostly navigational. Most of the ways we construct row setups and column layouts have remained the same, but getting around the software is significantly different. Filtering is one of the areas where we see this the most.
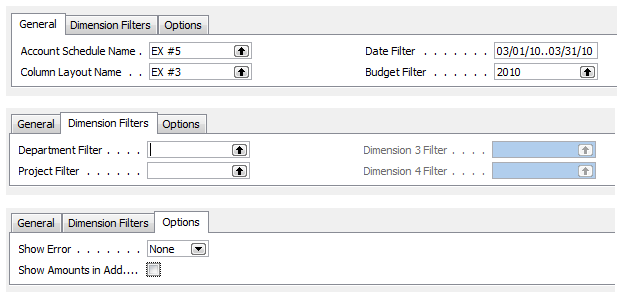
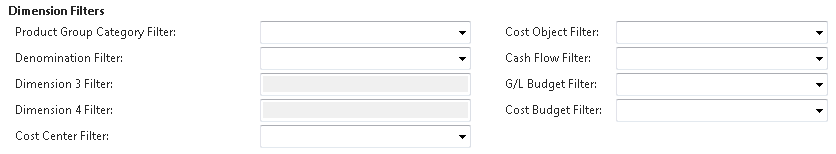
When filtering an account schedule in Classic versions, you have some very basic options to select your dates, budget, dimensions, and very little else.
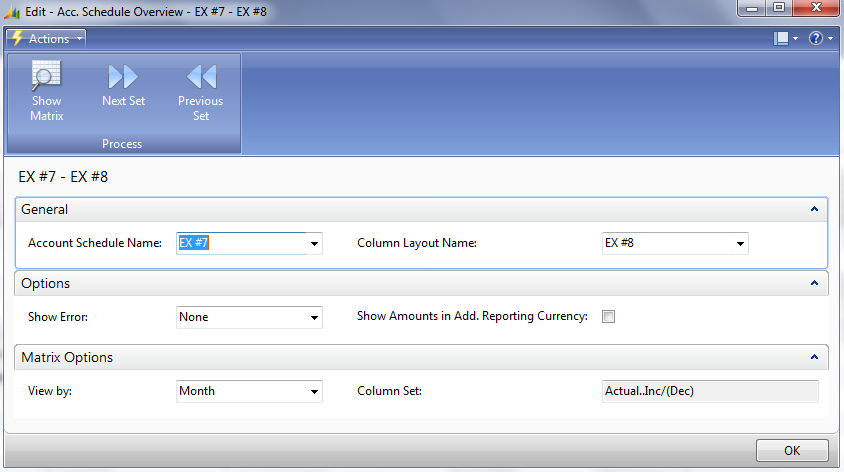
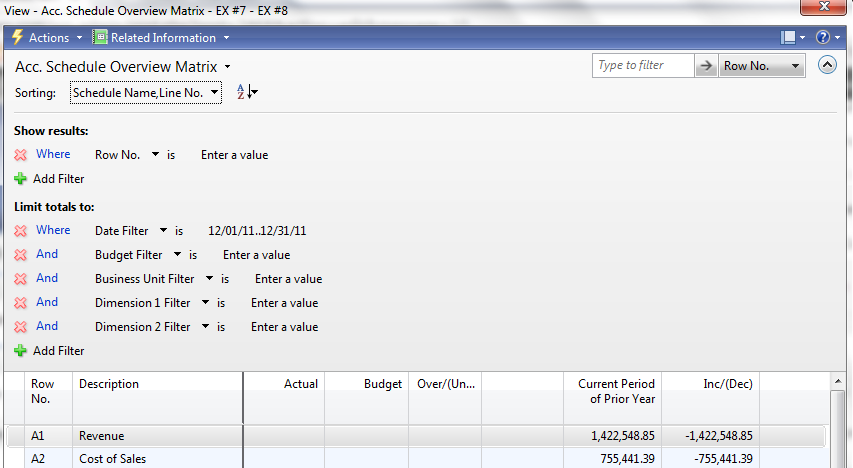
When filtering an account schedule in Role Tailored versions, you’ve suddenly got a whole new world of possibilities. 2009RTC makes things a little complicated, making us move through an additional screen on our way to the account schedule overview before we can apply additional filters once we get there. This has been my least favorite iteration of account schedules filtering because so many of the filters reset when you leave the screen, requiring you to continually redefine them when you come back or cheat the system by changing the work date in order to keep your sanity.
NAV2013 makes it all better with some great improvements and overall simplification. The new filtering eliminates the additional screen on the way to the overview, taking us directly there instead. The filtering is a nice improvement, keeping the frequently changed options up top and the set and forget filters on the bottom. The most important thing of all is that the next period and previous period buttons are back, allowing you to quickly change periods without having to type the full date in.
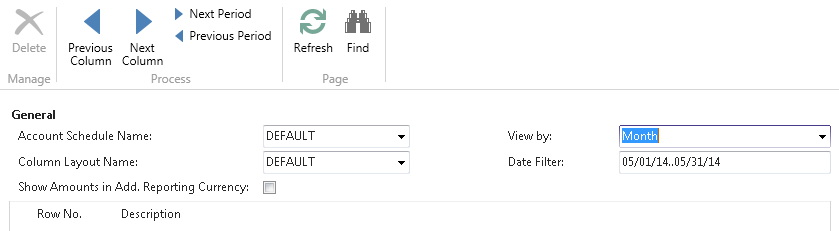
A nice new feature that lurks in the background are the previous and next column buttons. You’ll think you’ll never need them until you have an account schedule set up with more than 12 columns. The new freeze pane option is nice, but it decreases the number of columns available in your view. Use the shiny new next column button to see the rest of the info you need.
This posting is part of the NAV Account Schedules 101 series. Find the entire list of lessons here.
Don’t forget to visit the Account Schedule Formulas and Account Schedule Examples pages if you’re looking for even more ideas on how to improve your financial reporting using account schedules with Microsoft Dynamics NAV.
You’ve only got six weeks until June 30th. Who cares?
Posted: May 15, 2014 Filed under: Uncategorized 1 CommentYOU should! June 30th is the early bird registration deadline for NAVUG Summit, held this year in St. Louis, MO from October 14-17. There is no single other conference I can possibly recommend more than NAVUG Summit for NAV users. Every year as we go through the process of preparing great content to share with conference attendees I am amazed at the deep passion all of the conference organizers show when constructing the session schedule. I’ve been attending this conference for seven years now, and speaking for six of those years, and I can tell you this year is already shaping up to be the best year yet.
If you’re looking to learn more about NAV from other experienced NAV users, to deepen your professional skill set with new knowledge that is directly applicable to your work, and to network with people who use the same software in their jobs that you do every day, NAVUG Summit is the one event you need to attend this year.
You’ve got six weeks left to save $200 before the registration goes up. Make your list of what you need to learn and who you need to meet. Prepare your arguments to attend this incredibly valuable conference. Talk to your coworkers about why they should come with you. Get registered.
I wouldn’t miss it. You shouldn’t either. See you there!
NAV AS 101 Lesson 10: Comparison Period v. Comparison Date
Posted: May 14, 2014 Filed under: Uncategorized Leave a commentNAV Account Schedules uses a curious convention to determine periods of time in the column layout. The default option if you open account schedules for the very first time is Comparison Date, but I always recommend NAV users use the other option, Comparison Period. Let’s talk about why.

Comparison Period is more flexible
If you read the NAV help on this topic you’ll find a fairly long listing of what you can do with comparison period and a very short entry on what you can do with comparison date. That’s because you can just do a lot more with comparison period. Comparison dates use standard NAV date formulas that are really more appropriate for use in payment terms and journal entries.
I’ve copied both entries below, directly from the NAV help menus, for easy reference.
Comparison Date Formula Field
This field contains a date formula that specifies which dates should be used to calculate the amount in this column.
The program uses this formula to calculate the amount from the comparison period in relation to the period represented by the date filter on the report request.
For example:
|
-1Y |
Same period 1 year earlier |
Comparison Period Formula Field
This field contains a period formula that specifies which accounting periods should be used to calculate the amount in this column. An accounting period does not have to match the calendar, but each fiscal year must have the same number of accounting periods, even though each period can be different in length.
The program uses the period formula to calculate the amount from the comparison period in relation to the period represented by the date filter on the report request. The comparison period is based on the period of the start date of the date filter. The abbreviations for period specifications are:
|
P |
Period |
|
LP |
Last period of a fiscal year, half-year or quarter. |
|
CP |
Current period of a fiscal year, half-year or quarter. |
|
FY |
Fiscal year. For example, FY[1..3] denotes first quarter of the current fiscal year |
Examples of formulas:
|
<Blank> |
Current period |
|
-1P |
Previous period |
|
-1FY[1..LP] |
Entire previous fiscal year |
|
-1FY |
Current period in previous fiscal year |
|
-1FY[1..3] |
First quarter of previous fiscal year |
|
-1FY[1..CP] |
From the beginning of previous fiscal year to current period in previous fiscal year, inclusive |
|
-1FY[CP..LP] |
From current period in previous fiscal year to last period of previous fiscal year, inclusive |
Comparison Period reduces the possibility of accidentally reporting incorrect numbers
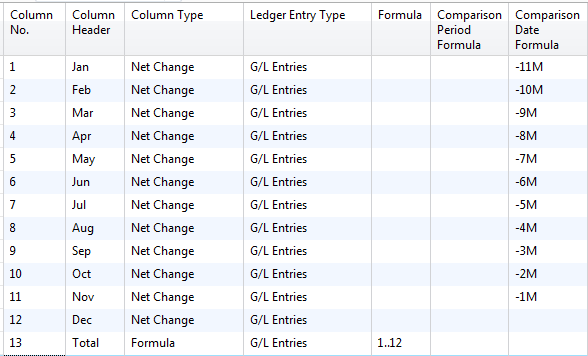
This is a classic example of an account schedule I see in use all the time by beginning account schedule users. Here is a 12 month net change column layout design using Comparison Date.
Here is a 12 month net change column layout design using Comparison Period.
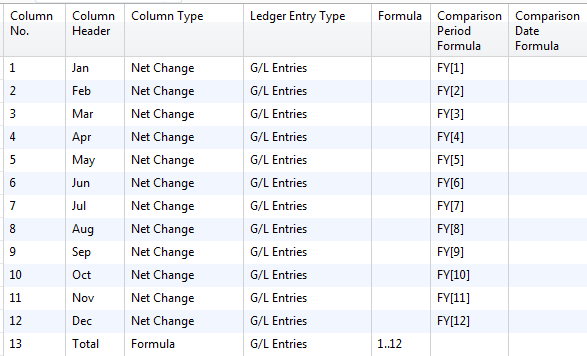
The primary difference between the two methods is that comparison period fixes the fiscal periods when you report and comparison date is wholly dependent upon what your date filter is set for.
If you are producing your financial statement package at the end of the month, you’ll produce your income statement, balance sheet, statement of cash flows and any other reports you use with the date filter set for the end of the month you are reporting against. When you get to this report, using comparison date, you’ve got to remember to manually switch your date filter to the end of the year, because the formulas calculate backward from the date set in order to produce the report.
This is very risky because if you forget to do this, you can very easily forget to not switch the date. In this case, the report will still produce 12 columns of numbers, but they’ll be wrong, because they are using the date from your date filter as your “year end” date, which is incorrect. When using the comparison period setup in the way shown above, you can change your date filter all you want within the current fiscal year and you’ll get the same correct result every time.
If you use an accounting period other than calendar month, you’ve got to use comparison period
You just can’t use comparison date if you’ve got 13 periods, if you use a 4-4-5 convention, or if you’ve got anything other than 12 calendar months defined as your fiscal periods.
Comparison date, what the heck’s it good for?
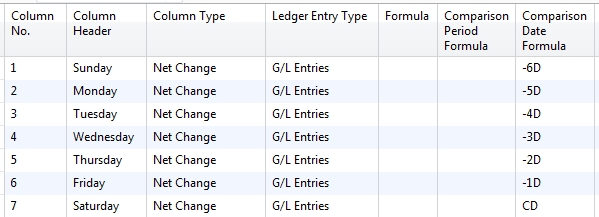
Despite everything you’ve read above, comparison date does have one really good use, and that is if you need to report on something on a daily or even weekly basis. Comparison period can’t go below the fiscal period unit, but comparison date sure can. Here’s an example of a column layout that defines time periods of daily for a week. Remember, in order for this to work, the date filter needs to be set to the last day of the week.
Where can I learn more about comparison period and comparison date?
Visit the Account Schedules Formulas page of this blog. This page was developed to answer the many questions I have gotten in my account schedules classes about what else you can do using comparison period. The entire page is full of screen shots, just like the ones you see above, so you can reference them or even copy them exactly, as you create your own account schedules.
This posting is part of the NAV Account Schedules 101 series. Find the entire list of lessons here.
Don’t forget to visit the Account Schedule Formulas and Account Schedule Examples pages if you’re looking for even more ideas on how to improve your financial reporting using account schedules with Microsoft Dynamics NAV.
Week Four Recap: Account Schedules 101
Posted: May 9, 2014 Filed under: Uncategorized Leave a commentHere’s the week 4 recap on the NAV Account Schedules 101 series. Follow the links below to view the posts for each of the lessons we covered this week or view the entire series here.
NAV AS 101 Lesson 8: Formatting
Don’t forget to visit the Account Schedule Formulas and Account Schedule Examples pages if you’re looking for even more ideas on how to improve your financial reporting using account schedules with Microsoft Dynamics NAV.
NAV AS 101 Lesson 9: Formulas
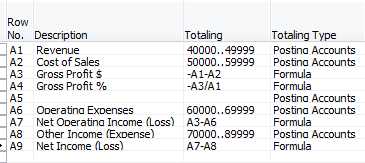
Posted: May 9, 2014 Filed under: Uncategorized Leave a commentFormulas in Microsoft Dynamics NAV Account Schedules are the hardest concept for most users to grasp, because their use is just not intuitive. There are a few basic concepts that can help get you started.
When getting started with a row setup, you need to choose either Posting Accounts or Formula in the Totaling Type column. These two options indicate whether you will be pulling numbers from general ledger accounts (posting accounts) or calculating against other rows (formula). There is another option Total Accounts that lets you pull numbers from total accounts from your chart of accounts instead if you are using total accounts instead of or in addition to posting accounts. Once you have defined your option in the Totaling Type column, then you need to populate the Totaling column with either general ledger accounts or formulas, depending on what you have chosen.
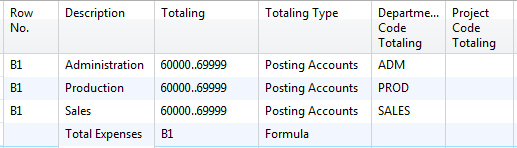
If you are a dimension user, you need to expand your selections to specific columns available in the row setup for dimensions. These are Dimension Totaling columns. The two global dimensions will always be available for use, but any other dimensions will appear with a label that is Dimension 3 Totaling or Dimension 4 Totaling (etc.) until you define which specific dimensions you want account schedules to use by defining them in analysis views. By filtering on dimensions in these columns, you can report at a deeper level and break down the segments of general ledger accounts to their dimension components in your financial reporting.
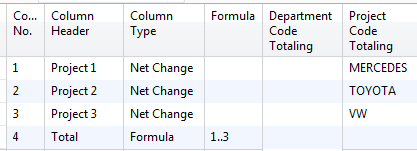
When getting started with a column layout, you need to choose either a definition of time like Net Change or Balance at Date or Formula in the Column Type column. These two options indicate whether you will be pulling numbers from general ledger accounts (posting accounts) or calculating against other columns (formula). If you have chosen Formula as your Column Type, you need to fill in the formula. The same options for Dimension Totaling are available here, just as they are for the row setup.
All the rest of the information you need about account schedule formulas happens in the Comparison Period Formula and Comparison Date Formula columns. There’s so much information there, we need to address it in a post of it’s own. Stay tuned, it’s coming up next!
This posting is part of the NAV Account Schedules 101 series. Find the entire list of lessons here.
Don’t forget to visit the Account Schedule Formulas and Account Schedule Examples pages if you’re looking for even more ideas on how to improve your financial reporting using account schedules with Microsoft Dynamics NAV.
")

