NAV dimensions in account schedules (part 11 of 15)
Posted: March 25, 2013 Filed under: Uncategorized | Tags: Account Schedules, Analysis Reports, analysis views, dimensions, financial reporting, NAV Leave a commentWe’ve spent a good deal of time talking about how to get dimensions into your financial data, now we need to talk a little bit about how to get that information back out in the form of reporting. One of the most direct ways to get financial reporting out of NAV is by using account schedules, which are the native NAV financial reporting package that report on general ledger transactions. Account schedules naturally access the two global dimensions for financial reporting in all cases, as shown below in the old classic client.
By applying analysis views to an account schedule, you get to choose any four of your dimensions, in any combination, to use for your financial reporting. This gives you much more flexibility and power in your financial reporting, allowing you to look at your financial data in many different ways. The most important thing to remember about analysis views is to keep them updated, whether you do this manually or in some automated way.
There are also tools like analysis by dimensions and analysis reports that can be used along with dimensions. For more information see this post Where can I learn more about NAV analysis reports and analysis by dimensions?
Keep reading this month as we continue our series, 15 Days of NAV Dimensions.
Expand your use of dimensions in NAV account schedules by using analysis views
Posted: October 2, 2012 Filed under: Uncategorized | Tags: Account Schedules, analysis views, budgets, Classic Client, codeunit 410, column layout, date compression, dimensions, Dynamics, Microsoft, NAV, row setup, RTC, update Leave a commentIf I had to pick only three basic elements to Microsoft Dynamics NAV account schedules, I’d have to choose row setups, column layouts and analysis views. Of course, row setups give you access to basic general ledger accounts and column layouts give you options on how to show that data in different time periods. So what do analysis views do for us? Analysis views give us the ability to reach into our dimensions, past the two globals, and into the list of shortcuts, allowing us to combine any four dimensions we want at a time in any account schedule.
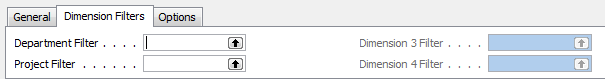
For illustration, I’m showing you an account schedule from NAV2009 Classic, which shows the dimension filters on an account schedule where no analysis view has been applied. The two global dimensions for CRONUS USA (Department and Project) are available to be selected on the dimensions filter tab and the remaining options are greyed out, unable to be used.

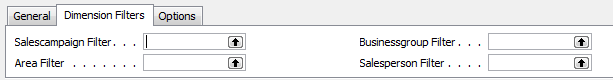
By selecting a different analysis view on the account schedule name page, you will have expanded options. Perhaps you’d like to apply an entirely different set of dimensions filters to your account schedule or limit the dimensions filters to only two of your shortcut dimensions. Any combination of four dimensions is available to you through analysis views.


There are a few things you need to know about analysis views before you start using them:
You can add a default analysis view to any account schedule. If you always want a certain account schedule to filter on a selected group of dimensions, this is the best way to do this.

Analysis Views must be updated. You can do this at any frequency you wish. Some companies choose to update once a month, some companies update once a day. Be aware that the process of updating pulls in any transactions that have been posted since the last update to your analysis view. This means if you post some entries during your close process, you’ll need to update your analysis view in order to show the change on your account schedule.

Updating can be done manually or it can be automated. To manually update analysis views, just hit the update button. You’ll need to do each one separately. Alternatively, you can choose to schedule codeunit 410 Update Analysis View as a regularly scheduled maintenance item in order to automate this process.
When you set up an analysis view for the first time, it can take a long time to update. Depending on the size of your database, if you don’t limit how far back your update goes, it could take a long time to update initially. Be careful by trying this out in a test system first. This process, which will normally take seconds when run daily, will take many hours if you don’t limit it and will cause table locks for other users.
If you test out an update and are afraid it will take up too much processing time, you have a couple of options. First, you can limit the start date of your update. One reason you might need a new analysis view is because you’ve added a new dimension. In this case, you really don’t need to go back to the beginning of time on your update. Choose the date you started gathering data on your new dimension as your starting date. You can also choose date compression. By compressing your data by day, week, month, quarter, period, or year, you limit how much detail you can see when you drill down. If you use this option, you’ll need to remember that this is a compressed view if you change column layouts to different time frame than your compression setting. Choosing date compression of none will allow you to drill down to full transactional detail.
Avoid using the update on posting button. This option updates your analysis view every time you post something to your system. Every sales order, every sales tax entry, every cash receipt, etc. will update real time. I’ve seen one small company use this option and it brought their system performance to a crawl.
Remember to include your budgets. If you make any changes to your budgets, you need to update that information on your analysis views as well.

Business Intelligence and Reporting Track helps solve user challenges at NAVUG Forum.
Posted: September 24, 2012 Filed under: Uncategorized | Tags: analysis views, business intelligence, Dynamics, JET, Microsoft, NAV, NAV 2013, NAVUG, reporting, RTC, user group Leave a commentJason Chance, Senior Programmer/Analyst at Seventh Generation and Business Intelligence and Reporting Track Leader for NAVUG Forum, guest blogs today on what the BI and Reporting Track has to offer end users at NAVUG Forum, the annual NAV end-user conference held in Seattle, October 15-18 2012.
 Without fail, whenever I lead a NAV roundtable discussion or training class, people talk about the reporting. I’ve only met a handful of people who are completely happy with their business reporting and most of them have spent significant resources developing reporting solutions outside of NAV. But before you throw in the towel on reporting in NAV, and spend a lot of time and money, you owe it yourself and your organization to understand what’s available in NAV. This is where NAVUG Forum 2012 comes in.
NAVUG Forum is an excellent event led by NAV users and professionals. It’s not a sales pitch. It’s not a glossy brochure full of fluff. It’s real NAV users sharing their experience and insight gained through years working with NAV. In the reporting and BI track we’ll focus how you can get the most out of the existing tools in NAV. With sessions like Reporting 101 and Reporting 102, you’ll learn how to create and modify NAV reports. Sessions on the Role Tailored Client will show you how to use the RTC to customize the data that you see in NAV. The Analysis Views and Jet Reports session will highlight two often under utilized reporting tools in NAV. The NAV 2013 sessions will give you a preview of what to expect in the newest version of NAV.
If you have issues and concerns with your reporting capabilities, chances are someone else has the same concerns, who knows, maybe they’ve already solved their problems. Come to NAVUG Forum, learn from your peers, build a network of colleagues that can help you get the most out of NAV.
See you in Seattle.
")

