Get the skills you need to produce robust financial reporting using the software you already own! New NAV2013 account schedules training now available!
Posted: August 14, 2013 Filed under: Uncategorized | Tags: Account Schedules, financial reporting, general ledger, learning, NAV 2013, NAVUG Academy, training Leave a comment Looking for training on NAV account schedules? There are new classes now available. NAVUG Academy distance learning is offering two half day instructor led online sessions on September 20th. There is also a full day classroom session on October 21st held as part of the pre-conference training for NAVUG Forum, held in sunny Tampa, Florida. Detailed descriptions of all three classes can be found below, or simply click on the title of the session you want to register!
Account Schedules: Basics – half day course, 9:00am to 1:00pm, (9/20)
Microsoft Dynamics NAV account schedules are a powerful tool used to create custom financial statements directly from your general ledger. In this in-depth training session, you will learn the fundamental principles of account schedule construction. This course is open to any NAV user.
Using hands-on exercises, you will have the opportunity to apply what you learn during class to a basic trial balance and master the three basic account schedule building blocks: row setups, column layouts, and analysis views. You’ll discover how to filter your financial reporting by dimensions, layer in budgeted information, and produce reports by exporting to Excel in the most efficient way possible!
In this class all hands-on exercises will be done using NAV2013. Almost all account schedule functions are applicable to lower versions of NAV, so you will still benefit from the training if you use a version below NAV2013.
Functionality of account schedules is virtually the same, but navigation and look and feel is significantly different. This class is being taught only in the NAV2013 version. If you are using the Classic Client and will not be moving to NAV2009 RTC or NAV2013 soon, please wait to take a Classic class. If you are an experienced Classic account schedule user who wants to learn more about NAV2009 RTC or NAV2013, it is recommended that you begin with the Account Schedules: Basics class simply to get used to the new navigational paths required.
Learning Objectives:
• Understand basic construction of row setups and column layouts
• Learn how to build, update, and apply analysis views
• Use filters, formulas, and formatting
• Incorporate dimensions and budgets
• Integrate account schedules to Excel
Instructor: Kerry Rosvold
Audience: Finance
Level: Intermediate
Prerequisites: Intermediate to advanced level of experience as a NAV financials end user
Account Schedules: Beyond the Basics – half day course, 2:00pm to 6:00pm, (9/20)
If you already understand the three basic account schedule building blocks and you’ve got a firm grasp on dimension and budget filtering (or if you’ve already taken Account Schedules Basics), you are ready to expand what you know with this class! This course is open to any NAV user.
Using hands-on exercises, you will have the opportunity to apply what you learn during class to a simple balance sheet and income statement. You’ll discover how to design and use multiple column layouts with the same row setup base and expand time periods reported beyond the basics. Move past simple dimension filtering and incorporate dimensions into row setups and column layouts! Learn how to use more advanced formulas like base for percent and see how to use account schedules as an alternative way to reporting from the NAV budget tool.
In this class all hands-on exercises will be done using NAV2013. Almost all account schedule functions are applicable to lower versions of NAV, so you will still benefit from the training if you use a version below NAV2013.
Functionality of account schedules is virtually the same, but navigation and look and feel is significantly different. This class is being taught only in the NAV2013 version. If you are using the Classic Client and will not be moving to NAV2009 RTC or NAV2013 soon, please wait to take a Classic class. If you are an experienced Classic account schedule user who wants to learn more about NAV2009 RTC or NAV2013, it is recommended that you begin with the Account Schedules: Basics class simply to get used to the new navigational paths required.
Learning Objectives:
• Build essential financial statements, including an income statement and balance sheet
• Extend knowledge of additional time periods used in column layouts
• Expand use of dimensions into account schedules
• Use account schedules to report on all budgeting information
Instructor: Kerry Rosvold
Audience: Finance
Level: Intermediate
Prerequisites: Intermediate to advanced level of experience as a NAV financials end user; have taken Account Schedule Basics or equivalent prior experience with account schedules
Account Schedules and Analysis Views – full day course, 8:00am to 5:00pm, (10/21)
Microsoft Dynamics NAV account schedules can be a powerful tool used to create custom financial statements and analysis reports directly from your general ledger. Attend this all day training session to get a firm foundation on the basic principles of account schedule construction and learn how to build all of your essential financial statements. Using hands-on exercises, you will have an opportunity to stretch beyond the basics and discover how to build multiple row and column layouts, how to create dynamic reports using dimensions, how to incorporate budgets into your schedules, and how to leverage the power of integration to Excel to make your reports even more flexible. Additional time will also be spent on analysis reports and analysis by dimensions.
Microsoft Dynamics NAV version: This class will be taught in NAV 2013, and backward compatible with NAV 2009 RTC. If you are using NAV 2009 Classic, you will benefit from the class as the concepts and approaches are the same, however the navigation and user interface is different. These differences will be addressed during class.
Learning Objectives:
• Build essential financial statements, including an income statement and balance sheet
• Understand construction of row setups and column layouts
• Use filters, formulas, and formatting
• Integrate account schedules to Excel
• Incorporate dimensions and budgets to account schedules
• Extend principles to use of analysis reports and analysis by dimensions
Instructor: Kerry Rosvold, Augsburg Fortress Publishers
Audience: Finance
Level: Intermediate
Prerequisites: Intermediate to advanced level of experience as a NAV financials end user
Blogiversary Top 20 (#3) Basic column layout options for NAV Account Schedules
Posted: April 25, 2013 Filed under: Uncategorized | Tags: Account Schedules, balance at date, Classic Client, column layout, comparison date formula, comparison period formula, financial statement, fiscal year, general ledger, NAV, net change, RTC Leave a commentWe’re celebrating our one year blogiversary by reposting the Top 20 Most Viewed in the last year, as determined by you, our readers! Follow this link to see the entire list. Enjoy!
Column layouts in NAV account schedules are what you build to add more flexibility to your financial statements. You can have an unlimited number of column layouts to match together with your already existing row setups. In general, most basic row setups contain general ledger numbers and column layouts contain dates. As an example, when I produce my income statement, I will have one row setup that reflects a summarized income statement and at least four different column layouts that reflect different configurations of month to date, year to date, comparisons against budget, and twelve month trended views.
Just like with row setups, there are many available options in the column layouts. This large variety of options can sometimes be overwhelming to the new account schedule user. I’ll show you which columns to choose in the column layouts for account schedules as a beginning point, and go through some simple explanations of how they are used.
Fields to start with:
Column No. – The column number is completely optional, but highly recommended. This simple element of the column layout will eventually be one of the key features of your account schedule, allowing you to calculate and organize with ease.
Column Header – This is where you’ll define, in words, what you’re showing in each column of your report. Keep it short; there is a 30 character limit.
Column Type: Net Change, Balance at Date, or Formula – There are actually seven options to choose from here, but I recommend that you limit yourself to these three when you’re just getting started. The key here is knowing what type of accounts you’re reporting on. If you’re using income statement accounts (Revenue/Expense), then you need to use net change. If you’re using balance sheet accounts (Assets/Liabilities), then you need to use Balance at Date. Formula allows you to perform calculations in a column.
Ledger Entry Type – This column will allow you to define what type of ledger entries you will show. This is where you can choose actual general ledger entries or budgeted general ledger entries.
Formula – If you’ve chosen Formula as the Column Type, this is where you’ll put the formula.
Comparison Period Formula – This column allows you to define date formulas that are used to calculate the amounts shown. I generally recommend that beginning account schedule users start out using the comparison period formula field instead of the comparison date formula field. The comparison period formula field references the accounting periods set up in the fiscal year, so this option seems the most consistent, and is especially necessary for companies that may not follow a calendar fiscal year. Common data labels used in this field are CP for current period or -1CP for previous period and FY for fiscal year or -1FY for prior year.
Shown below are both the design view and the user view of a column layout for a summarized income statement showing year to date and prior year to date information in the columns to demonstrate the use of these six basic options in an account schedule.
Role Tailored Client


Classic Client


For more information on row setups, please see these posts: Basic row setup options for NAV Account Schedules and Complete row setup options for NAV account schedules.
If you’re just beginning to use account schedules, see Getting started with a new account schedule.
Blogiversary Top 20 (#9) Where can I learn more about NAV analysis reports and analysis by dimensions?
Posted: April 17, 2013 Filed under: Uncategorized | Tags: analysis by dimensions, Analysis Reports, CustomerSource, export to excel, general ledger, item ledger entries, NAV, pivot table, query tool, reporting tool Leave a commentWe’re celebrating our one year blogiversary by reposting the Top 20 Most Viewed in the last year, as determined by you, our readers! Follow this link to see the entire list. Enjoy!
Analysis reports and analysis by dimensions are the native reporting options that extend NAV reporting to the item ledger entries generated from the sales, purchasing, and inventory areas of the application. I find that many users don’t know that this reporting option exists and think it is one of the more underutilized areas by NAV financial users.
These reporting options can be found on the general ledger, sales & marketing, purchasing, and inventory menus.
The main advantage this reporting tool has over account schedules is that it reaches a further level of detail that just isn’t recorded on the general ledger. Being able to get to quantity information at the item or location level in addition to the dollar values posted makes these tools great as a way to get operational reporting.
What is the difference between the two?
Analysis by dimensions is a query tool. The key to using this tool effectively is to use aggressive filtering, especially if you have a large number of items. It can be a very quick way to get information about what may be going on with a single or small group of items. You can also export to Excel and it shows up in a pivot table.
Analysis Reports allow you to configure and save row setups and column layouts for later use, which makes it a reporting tool. These reports work a lot like account schedules, with some added features to accommodate the additional data you can reach because you’re reporting against the item ledger entry tables instead of the general ledger.
A few hints on analysis reports and analysis by dimensions:
- Skip the analysis report on the general ledger menu and use accounts schedules; you’re not going to get any added value here.
- When posting sales or purchase orders, you must be fully utilizing the sub module, i.e. do not allow any posting of lines to general ledger accounts on the sales or purchase order documents. Any posting that goes “around” these modules will cause your analysis report to show a lower number than what is on your general ledger. Avoid the argument of reporting credibility by understanding this, and either being able to explain the variance, or prevent it from happening altogether.
- Know that analysis reports will not automatically update if you add new items. You’ll need to go in and do this manually to each report every time you add new items.
For those of you who are looking for more resources on Analysis by Dimension and Analysis Views, reference the documents below, found on Customer Source:
Documentation => User Guides => Overview of Training Manuals and Hands-On Labs for Microsoft Dynamics NAV 2009
- Trade in Microsoft Dynamics NAV 2009 – Chapter 9
- Business Intelligence for Information Workers in Microsoft Dynamics NAV 2009 – Chapter 5
Documentation => User Guides => Overview of Training Manuals for Microsoft Dynamics NAV 5.0
- Trade in Microsoft Dynamics NAV 5.0 – Chapter 10
- Business Intelligence for Information Workers in Microsoft Dynamics NAV 5.0 – Chapter 6
Blogiversary Top 20 (#11) Complete row setup options for NAV account schedules
Posted: April 15, 2013 Filed under: Uncategorized | Tags: Account Schedules, balance at date, Classic Client, column layout, dimensions, Excel, export to excel, financial statement, general ledger, NAV, net change, posting accounts, row setup, RTC, set base for percent, setup options, show opposite sign, totaling type, trial balance Leave a commentWe’re celebrating our one year blogiversary by reposting the Top 20 Most Viewed in the last year, as determined by you, our readers! Follow this link to see the entire list. Enjoy!
About a month ago, I published a post called Basic row setup options for NAV account schedules. This is a great place to look if you’re just getting started. However, if you’re looking for what else you can do with Microsoft Dynamics NAV account schedules, then this is where you want to be. This post will go through each and every field available on the account schedule row setup and talk about the available options. The functionality of these fields are exactly the same between the Classic and Role Tailored Clients. The only difference is in how they look on the screen and how you navigate between screens. Take a look at the pictures below to find the look you’re familiar with, but then keep reading for the explanations of what these fields will do in your financial reporting.
Role Tailored Client
This is a view of what I recommend you start with for basic row setup options.

This is a view of all available row setup options.

Classic Client
This is a view of what I recommend you start with for basic row setup options.

This is a view of all available row setup options.

Row setup options – apply to both clients
Row No. is completely optional, but highly recommended. This simple element of the row setup will eventually be one of the key features of your account schedule, allowing you to calculate and organize with ease.
Description is the one place you have to communicate, in words, what you’re showing on each line of your report.
Totaling Type: 6 options to choose from
- Posting Accounts pull data from your accounts designated as posting accounts on the G/L Account Card Account Type field.
- Total Accounts pull data from your accounts designated as a total or as an end-total on the G/L Account Card Account Type field.
- Formula allows you to calculate a basic formula on this row.
- Underline places a single underline .
- Double Underline places a double underline.
- NOTE: This nifty addition showed up with NAV 2009 R2. If you are NAV 2009 SP1 or earlier, this won’t be available to you.
- Both of the underline functions are there to give folks who print account schedules directly out of NAV some formatting options. If you’re exporting to Excel you’ve got some better format options to work with than these.
- Set Base for Percent allows you to designate which row from your row setup will be used as the beginning point for a section to be included in a percent of total calculation. This feature showed up in version 5.0 and must be used together with a formula on another row to designate the end point of the section as well as some setup in the column layout. It’s a little fussy in the setup and inelegant in execution, but is still effective to get those vital comparative percentages onto your account schedules.
Totaling will be which general ledger accounts you want to pull or what formula you want to calculate, depending on what you selected in totaling type.
Row Type: 3 options to choose from
- Net Change should be used, generally, if you’re reporting on income statement accounts (revenue/expense).
- Balance at Date should be used, generally, if you’re reporting on balance sheet accounts (assets/liabilities).
- Beginning Balance will be sparingly used, but you’ll want this for your statement of cash flows at some point.
Amount Type gives you three options: Net Amount, Debit Amount and Credit Amount. You’re going to use Net Amount almost all the time, but I suppose if you were getting very granular in your account schedules and perhaps using them for detailed reconciling reports, this might be useful. If I’m getting down to this level of transactional detail, I’m usually going to the chart of accounts instead of account schedules.
Formatting Fields: Bold, Italic, and Underline These basic formatting fields are there to allow you to emphasize some of the rows of your account schedules. When you select these options on any row, the whole row is effected. You are not able to effect a single “cell” for formatting. What’s the difference between underline here and underline found in the Totaling Type options? You can get a more snug fit on your underline using this option since it appears in the same row of your data instead of in a row if its own.
New Page inserts a page break. This is commonly used when separating the pages of the balance sheet showing assets on the first page and liabilities and equity on the second page. I have also seen it used when folks build multi page account schedules.
Show Opposite Sign is the option you can select to change revenue credit balances or expense debit balances to the opposite sign for the purposes of presenting this data in a more non-finance friendly manner. No salesperson wants to see sales presented with a negative sign; use this to change that credit to a positive number on your reporting.
Show allows you to designate if a row will show (the default) or be hidden on the printed account schedule only. You can click this box as much as you want, but your rows will still show on-screen or when you export to Excel. If you print directly out of account schedules, this feature will work very well for you.
Dimension Totaling is the last option available and you might have noticed that I didn’t show them on pictures above. This is because they are unique for just about every user, and depending on your analysis view setup, may even be different from schedule to schedule. You can use just one, or you can use all four of the available dimension totaling fields, in whatever combination you like. These fields act very much like the Totaling field because this is where you will tell NAV what Dimensions you want shown and totaled from your general ledger accounts.
Blogiversary Top 20 (#19) The NAV accountant’s little helper: the reconciliation account check box
Posted: April 3, 2013 Filed under: Uncategorized | Tags: balance after posting, Classic Client, general ledger, journal entry, NAV, net change, posting test report, reconciliation account, RTC, tips and tricks Leave a commentWe’re celebrating our one year blogiversary by reposting the Top 20 Most Viewed in the last year, as determined by you, our readers! Follow this link to see the entire list. Enjoy!
There’s a tiny feature in NAV that I take for granted. It’s there, in the background, hiding in the setup, and it helps me out just a little almost every time I make a manual journal entry. Especially if I’m in a bit of a rush, or distracted, this option gives me one more quick but effective look at what I’m doing before I commit a journal entry to my books permanently. This nifty little thing can be added to your NAV setup at any time without any help from IT and won’t require any maintenance. The option I’m talking about is the Reconciliation Account check box you can find on your general ledger account card. Here’s where you can find it:
Role Tailored Client

Classic Client

For any account where you’d like this additional double check, check the Reconciliation Account box found on the General Ledger Account Card. Now go put together your journal entry.

Instead of posting directly from the entry, choose Actions=>Posting=>Test Report=>Preview (if you’re RTC) or just choose Posting=>Test Report=>Preview (if you’re Classic). NAV will put together a handy dandy print preview which will now include a section at the bottom labeled Reconciliation. This little section will show you which direction your entry is going in, what sign your ending balance will be, and what the actual balance after posting will look like. This all happens before you commit it as final to the system. This may be just the extra bit of help you need in order to keep you from making an error. If you like what you see, post that journal entry!

If you have an account where you’ve got a lot of daily activity, you may not find this as useful as you do with accounts with just a little bit of activity throughout the month because you’ll have a more frequently changing end balance. Decide what might be useful to you.
Next time you do a journal entry, give it a try. Go to the account card and check the box. Make your journal entry. Before you post, run the posting test report. Is the net change in your journal entry going in the right direction? Did you enter the correct account? Is your ending account balance the right sign? Most importantly, is the balance after posting what you expected? This little helper can give you a quick preview before you hit post and save you from having to reverse and correct an entry.
DynamicsNAVFinancials blog celebrates one year with top 20 postings
Posted: April 1, 2013 Filed under: Uncategorized | Tags: Account Schedules, budgets, Classic Client, Convergence, dimensions, Dynamics, Excel, export to excel, financial reporting, financial statement, general ledger, NAV, NAV 2013, NAVUG, payment terms, PowerPivot, tips and tricks, user group 2 Comments It’s our blogiversary! I started this blog in April 0f 2012, inspired by the number of NAV end users I had met over the last year who had the same questions that just weren’t getting answered. What better way to get that information out to folks than a blog where I could write up the topic in an easy to understand way?
You’ve shown your support! Over that last year, we’ve had over 15,000 views, almost 100 followers via email, have people following us on our new Facebook page, and know that many of you follow postings through the RSS feed. People from more than 120 countries are reading DynamicsNAVFinancials! The blog has gotten enough attention to be picked up for syndication through Microsoft Dynamics Community and I was even asked to participate as one of the eleven official bloggers at Microsoft Dynamics Convergence 2013 last month.
Special thanks has got to go to the NAVUG. The user group has been especially supportive of me and of the blog, finding opportunities for me to speak to NAV users in person, in webinars, online classes, and through this blog. Without the support of the user group this would have been a much longer road and I am so grateful for the constant work they have done to get me in front of as many readers as possible.
Publishing over an entry a week in the last year, there’s a lot to choose from, but in the month of April, I’ll be re-running the top 20 postings determined by the most viewed entries. Enjoy, and thank you so much for reading! There would be no reason to do this without you!
19 The NAV accountant’s little helper: the reconciliation account check box
18 Learning about Microsoft Dynamics NAV 2013: on demand learning from NAVUG is a fantastic resource!
17 Tis the (Budget) Season! Three handy NAV account schedule tips to get you through
16 Tips and tricks for a flawless budget load in NAV
15 Why NAV users should be using dual monitors
14 Video Demo: How to export NAV account schedules to Microsoft Excel
13 Basic row setup options for NAV Account Schedules
12 Aging methods in NAV – which buckets are you looking for?
11 Complete row setup options for NAV account schedules
10 Learning about Microsoft Dynamics NAV 2013
9 Where can I learn more about NAV analysis reports and analysis by dimensions?
8 10 easy tips for payment terms success in Microsoft Dynamics NAV
6 Getting started with a new account schedule
4 Maximize your Microsoft Dynamics NAV 2009 Classic screen space with user level configuration options
3 Basic column layout options for NAV Account Schedules
2 NAV keyboard shortcuts – Classic to RTC
1 The Account Schedules Formulas Page
The finance professional’s perspective on NAV dimensions (part 3 of 15)
Posted: March 13, 2013 Filed under: Uncategorized | Tags: dimensions, financial statement, general ledger, NAV, tips and tricks Leave a commentAs the finance person for your company who will make decisions about dimensions, you bring a unique perspective to how dimensions can be valuable in your accounting department. Some of the concerns you have will surround reporting requirements, some will pertain to consistency and control, and others will relate to efficiency. Let’s go through each of those concerns.
Efficiency
As a corporate controller, I’m concerned that my staff work in an efficient manner. In regard to coding invoices or general ledger entries, this means they shouldn’t need to look up a lot of information and they don’t engage in any more data entry than they absolutely have to. When choosing how dimensions will be set up in NAV, you can make some specific choices regarding how data can be populated. Do you want the coding to come in as a default value? Are your coding relationships rule-based enough to make that possible? Are there some things you can populate to always default so the coding appears as if by magic 100% of the time and an employee never needs to be responsible for making a coding decision?
Consistency and Control
In the same way that I’m a stickler about operating efficiently, I’m even more so about having consistency and control. If you ever work with me, at some point you will hear me say, “we do not allow optional data”. This means we don’t gather dimensions for some data and not for others. I use the default value code mandatory a lot in my system. This setting will force a dimension to be populated whether it is through a default value or by a person, but it will never allow the data to come through with a blank value, creating holes and reduced value data in my reporting.
Reporting Requirements
Ultimately, you’re using dimensions in your ERP system so you can get great reporting out of it to make important business decisions. As your company’s finance professional, you know what you’re reporting on now. Take a minute to think about that. Is what you’re reporting on still relevant or is it what you’ve always reported on? Has your business changed? Does your reporting need to change too? Think about what your business really needs to see in its reporting and structure your dimension choices to match.
Keep reading this month as we continue our series, 15 Days of NAV Dimensions.
5 reasons you need to use NAV dimensions (part 2 of 15)
Posted: March 12, 2013 Filed under: Uncategorized | Tags: accounts payable, dimensions, financial statement, general ledger, NAV, tips and tricks 1 Comment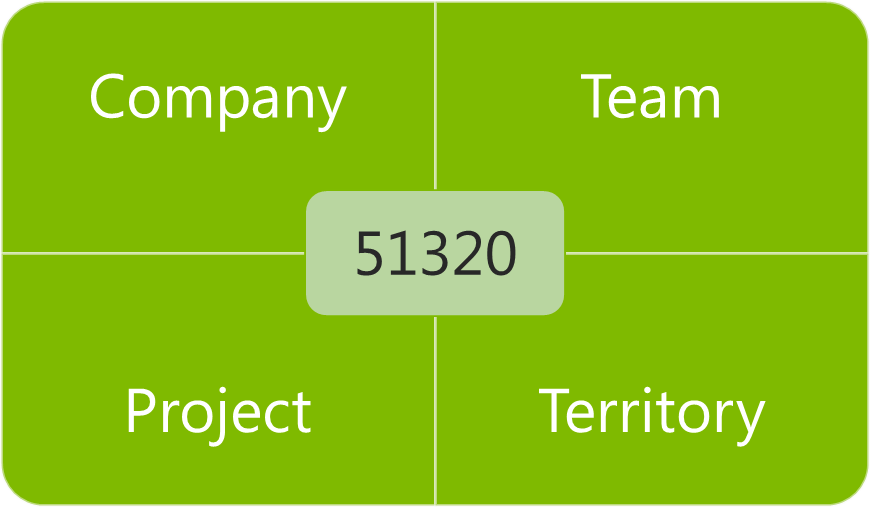 Still not convinced that leaving your old multi-segmented chart of accounts behind is a good idea? Don’t know exactly what in the world that crazy grid illustration with a number in only one box and words in the rest has to do with accounting, at all? Here are my five reasons for why you should be using dimensions.
1) Your chart of accounts is shorter. Seriously now, my company was the one with the 4,000 accounts in the chart of accounts before we installed NAV. We used project codes heavily, and had three to four segments to each base general ledger account number. Every member of the accounting team had this gigantic dog-eared book on their desk they would reference as they went through their day. Not only was it impossible to remember all that detail, it took a long time to type those numbers into the system, and with so many manually entered numbers, it was very easy to make a mistake. We spent a full two days every month during the close investigating and researching whether things went into the right place and then constructing reclassifying entries to correct the errors. My chart of accounts is less than 200 accounts now, and we eliminate a few more every year.
2) Account coding becomes intuitive. We still use project codes heavily, but now we’re able to give them a name as well as a number, which makes the coding process much more intuitive, less prone to error, and allows people outside the accounting department to enter data into the system. We work with a lot of non-numbers people at our company, and just talking about money has become easier since we started using dimensions. Nobody needs to get out the big dog-eared book to “determine the coding for your recent T&E”. We can use actual English and say things like, “Code that expense report to the Marketing team for the recent children’s sunday school event in Ohio” and everyone knows where that will be coded when the invoice gets entered to NAV.
3) Better control and accuracy. Certainly with having more intuitive coding and a shorter chart of accounts, we should all see some improvement in control and accuracy of postings. But wait, there’s more! NAV does a fantastic job of layering in more features for dimensions like allowing automatically populated default values, adding warning messages to make sure you get the right kind of dimension in the right place, allowing control at the level of your master data as well as your chart of accounts, and allowing restrictions on what dimensions can be combined with other dimensions and with what priority. All of these features combine to make sure the computer does the work instead of your employees and does it more accurately. Remember those two days my company used to spend to review and correct entries with reclassifications? Last year, I was able to send out an email out for three month end closes letting my team know they had a perfect posting month – no errors – not a single reclassification.
4) Greater flexibility in your reporting. Even with this shorter chart of accounts, we actually have more detail than we had before, because getting more detail through use of dimensions makes it possible. The idea of adding another segment in the old system to support a changing reporting need was heinously prohibitive. With dimensions, we gain that flexibility without adding another 400 pages to our chart of accounts. We produce more reports with more valuable information now than ever before, and we have the ability to combine the data we’ve gathered in more flexible combinations to assist us in making business decisions.
5) You’ll continue to have more options, even after go-live. I think a lot of people believe the only time they can make decisions about dimensions is when they are initially implementing. While this is a very important time to lay the foundation for your NAV system, you do have the option to add or change dimensions as you go along. We’ve actually added about one new dimension annually, as our business needs have changed, and as we’ve determined we need to report on different priorities.
Keep reading this month as we continue our series, 15 Days of NAV Dimensions.
Looking for a how to guide on running the year end close in NAV? Here are 3!
Posted: January 22, 2013 Filed under: Uncategorized | Tags: CustomerSource, general ledger, manual, NAV, year end close Leave a commentAll your journal entries are done, all of your modules balance to the general ledger, and your inventory period is closed. You are ready to get that income statement rolled up and close the year. Now where were those instructions? It’s not unusual to be a little unsure about the year end close process – we only get to do it annually, so no one will blame you if you can’t remember exactly what you did last year, and in what order. Here are a couple of resources to help you out.
ABC Computers, Inc. has a nice entry on their technology blog, “How to Close a Fiscal Year in Microsoft Dynamics NAV: Instructions for Annual Closing Operations“. This goes through a quick top level summary and then a deep dive into the closing process with field by field instructions.
If video learning is more your style, Archerpoint has a short 3-4 minute video out there, “Closing the Fiscal Year in NAV” that shows the annual closing process screen by screen.
 Finally, you can always get the full manual on the year end closing process straight from Customer Source. Log in and type in 80041 into the search box. This will get you directly to the “Finance in Microsoft Dynamics 2009” Microsoft course. Download the course and go straight to the file for Chapter 10 – Year End Closing Processes.
Remember, you can always make entries after you’ve gone through your initial income statement rollup. You don’t need to wait for that very last entry to get this process going.
The NAV accountant’s little helper: the reconciliation account check box
Posted: September 18, 2012 Filed under: Uncategorized | Tags: balance after posting, Classic Client, general ledger, journal entry, NAV, net change, posting test report, reconciliation account, RTC, tips and tricks Leave a commentThere’s a tiny feature in NAV that I take for granted. It’s there, in the background, hiding in the setup, and it helps me out just a little almost every time I make a manual journal entry. Especially if I’m in a bit of a rush, or distracted, this option gives me one more quick but effective look at what I’m doing before I commit a journal entry to my books permanently. This nifty little thing can be added to your NAV setup at any time without any help from IT and won’t require any maintenance. The option I’m talking about is the Reconciliation Account check box you can find on your general ledger account card. Here’s where you can find it:
Role Tailored Client
Classic Client
For any account where you’d like this additional double check, check the Reconciliation Account box found on the General Ledger Account Card. Now go put together your journal entry.
Instead of posting directly from the entry, choose Actions=>Posting=>Test Report=>Preview (if you’re RTC) or just choose Posting=>Test Report=>Preview (if you’re Classic). NAV will put together a handy dandy print preview which will now include a section at the bottom labeled Reconciliation. This little section will show you which direction your entry is going in, what sign your ending balance will be, and what the actual balance after posting will look like. This all happens before you commit it as final to the system. This may be just the extra bit of help you need in order to keep you from making an error. If you like what you see, post that journal entry!
If you have an account where you’ve got a lot of daily activity, you may not find this as useful as you do with accounts with just a little bit of activity throughout the month because you’ll have a more frequently changing end balance. Decide what might be useful to you.
Next time you do a journal entry, give it a try. Go to the account card and check the box. Make your journal entry. Before you post, run the posting test report. Is the net change in your journal entry going in the right direction? Did you enter the correct account? Is your ending account balance the right sign? Most importantly, is the balance after posting what you expected? This little helper can give you a quick preview before you hit post and save you from having to reverse and correct an entry.
This posting is one of the Top 20 Most Viewed in the last year! Follow this link to see the entire list.
")

