5 reasons you need to use NAV dimensions (part 2 of 15)
Posted: March 12, 2013 Filed under: Uncategorized | Tags: accounts payable, dimensions, financial statement, general ledger, NAV, tips and tricks 1 Comment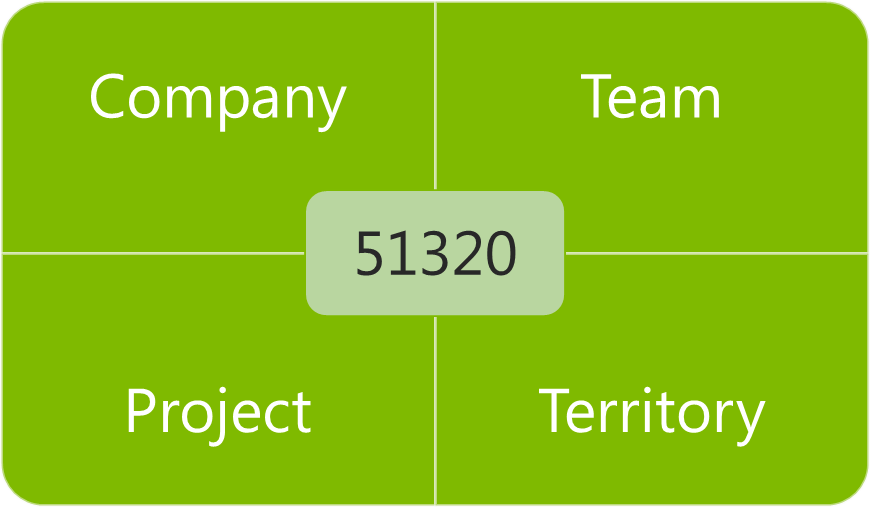 Still not convinced that leaving your old multi-segmented chart of accounts behind is a good idea? Don’t know exactly what in the world that crazy grid illustration with a number in only one box and words in the rest has to do with accounting, at all? Here are my five reasons for why you should be using dimensions.
1) Your chart of accounts is shorter. Seriously now, my company was the one with the 4,000 accounts in the chart of accounts before we installed NAV. We used project codes heavily, and had three to four segments to each base general ledger account number. Every member of the accounting team had this gigantic dog-eared book on their desk they would reference as they went through their day. Not only was it impossible to remember all that detail, it took a long time to type those numbers into the system, and with so many manually entered numbers, it was very easy to make a mistake. We spent a full two days every month during the close investigating and researching whether things went into the right place and then constructing reclassifying entries to correct the errors. My chart of accounts is less than 200 accounts now, and we eliminate a few more every year.
2) Account coding becomes intuitive. We still use project codes heavily, but now we’re able to give them a name as well as a number, which makes the coding process much more intuitive, less prone to error, and allows people outside the accounting department to enter data into the system. We work with a lot of non-numbers people at our company, and just talking about money has become easier since we started using dimensions. Nobody needs to get out the big dog-eared book to “determine the coding for your recent T&E”. We can use actual English and say things like, “Code that expense report to the Marketing team for the recent children’s sunday school event in Ohio” and everyone knows where that will be coded when the invoice gets entered to NAV.
3) Better control and accuracy. Certainly with having more intuitive coding and a shorter chart of accounts, we should all see some improvement in control and accuracy of postings. But wait, there’s more! NAV does a fantastic job of layering in more features for dimensions like allowing automatically populated default values, adding warning messages to make sure you get the right kind of dimension in the right place, allowing control at the level of your master data as well as your chart of accounts, and allowing restrictions on what dimensions can be combined with other dimensions and with what priority. All of these features combine to make sure the computer does the work instead of your employees and does it more accurately. Remember those two days my company used to spend to review and correct entries with reclassifications? Last year, I was able to send out an email out for three month end closes letting my team know they had a perfect posting month – no errors – not a single reclassification.
4) Greater flexibility in your reporting. Even with this shorter chart of accounts, we actually have more detail than we had before, because getting more detail through use of dimensions makes it possible. The idea of adding another segment in the old system to support a changing reporting need was heinously prohibitive. With dimensions, we gain that flexibility without adding another 400 pages to our chart of accounts. We produce more reports with more valuable information now than ever before, and we have the ability to combine the data we’ve gathered in more flexible combinations to assist us in making business decisions.
5) You’ll continue to have more options, even after go-live. I think a lot of people believe the only time they can make decisions about dimensions is when they are initially implementing. While this is a very important time to lay the foundation for your NAV system, you do have the option to add or change dimensions as you go along. We’ve actually added about one new dimension annually, as our business needs have changed, and as we’ve determined we need to report on different priorities.
Keep reading this month as we continue our series, 15 Days of NAV Dimensions.
4 questions to ask when deciding how to use NAV dimensions in your business (part 1 of 15)
Posted: March 11, 2013 Filed under: Uncategorized | Tags: chart of accounts, dimensions, NAV 1 CommentIf you’re just getting started with Microsoft Dynamics NAV for your business, you’ve probably heard the term dimensions, but you don’t really know what that means yet. You may be someone in the finance area for your company, or you may be an IT person. Eventually, at some point in your planning process, your partner is going to have “the talk” with you. This is an important talk, and it can be a little scary or even a little bit embarrassing, but it is absolutely necessary. The talk will probably start with, “have you thought about how you’ll clean up your chart of accounts”, or “we need to discuss how you will restructure your chart of accounts”, or “you could realize some serious efficiencies in your posting processes by reducing your chart of accounts”, or “holy cow, 4000 accounts is a whole lot, how do you remember all that?”.
Here are the four questions you should be asking yourself when deciding if you need to use dimensions at your company:
1) How long is your chart of accounts?
2) Do you recognize a number that looks like this? 01-810-51320-627539
3) How often do you answer this question? How do I code . . .
4) How many reclassifying entries are you making every month?
You might get the idea by now that using dimensions allows you to clean up your chart of accounts, reduce it in size, and increase your efficiency by doing so, and you would be exactly right. At its most basic, using dimensions will allow you to replace your old multi-segmented account numbers

with something that looks a little bit more like this.
Keep reading this month as we continue our series, 15 Days of NAV Dimensions.
It’s Convergence time! Where will you find the NAV people?
Posted: March 11, 2013 Filed under: Uncategorized | Tags: Convergence, NAV, NAVUG, networking, user group 1 CommentAnyone who knows me will nod their head and smile if you describe me as a compulsive planner. I have a white board in my office and my kitchen, my best friend will be happy to tell you an old college story about me and excessive use of index cards, and I’ve already been using my Convergence Schedule Builder for weeks. The biggest question I have every year is: where will I find the NAV people? With projections of over 11,000 attendees in 2013, it can be a serious challenge to find folks to network with who are using the same ERP solution. Here’s my list of where I’ll be looking for other people who use NAV every day, just like I do. 
1) Watch for any session labeled with ID, these are interactive discussions and are generally your best bet to find like-minded NAV professionals. The bonus of attending these sessions is that participants are encouraged to interact and discuss the topic during the session. This is a great opportunity to ask questions of other NAV users, but is also a great chance to introduce yourself to someone later. Catch them in the hall with a quick, “that was a great point you made on database optimization in that last session” and you’ve got an instant conversation starter.
2) NAVUG, the NAV user group, is giving a session on Wednesday at 12:30 titled “Get to know NAVUG – your resource group for all things Microsoft Dynamics NAV”. If you haven’t been involved with the user group yet, this is a great way to hear what they’re all about, meet a few folks, and see what they have to offer during the year. The user group also has a booth in the Expo hall.
3) Go to the ILOVENAV.com booth, also in the Expo hall. This is a wonderful group of people who are looking to give NAV users a voice, using idea crowdsourcing, in what happens next with their chosen ERP solution.
4) Head to the Microsoft help desk. There is sure to be a line of people waiting for their appointed NAV guru to help them solve business challenges. Most of the folks standing there will also be NAV users, so don’t hesitate to strike up a conversation.
5) Watch for the user group banner in the meal hall. There’s generally a banner somewhere in the meal hall that indicates a special roped off area for user group members. Do not be intimidated by the rope! If you’re looking to meet other NAV users, come on in and come on over! Folks in the NAVUG are always happy to meet a fellow NAV user.
See you there!
15 days of NAV dimensions
Posted: March 11, 2013 Filed under: Uncategorized | Tags: Account Schedules, Convergence, CustomerSource, dimensions, Dynamics, NAV, NAV 2013, tips and tricks 1 CommentMarch Madness may mean basketball for some folks, but for me it means Convergence! Getting a chance to participate as a speaker at Microsoft Dynamics Convergence is a great opportunity to meet new NAV users I haven’t met before. I’m always looking to expand my network of knowledgeable professionals, and one of the ways I do that is by sharing information.
I’m lucky enough to be giving a concurrent session this year called Tips & Tricks for Working with Dimensions in Microsoft Dynamics NAV and I thought I would put together a series for the blog on the same topic to get the information out to a wider audience. For the next 15 days, there will be a brand new post on one of these dimension topics. Enjoy!
Day 1 4 questions to ask when deciding how to use NAV dimensions in your business
Day 2 5 reasons you need to use NAV dimensions
Day 3 The finance professional’s perspective on NAV dimensions
Day 4 Why finance and IT need to work in partnership on a NAV dimension strategy
Day 5 Viewing NAV dimensions on postings: where can you see them?
Day 6 NAV default dimensions and value postings applied to master data
Day 7 NAV default dimensions and value postings on the chart of accounts
Day 8 NAV dimension combinations for additional accuracy
Day 9 NAV dimension priorities
Day 10 Resolving NAV dimension errors
Day 11 NAV dimensions in account schedules
Day 12 NAV dimensions in budgets and consolidations
Day 13 Communicating to IT about NAV dimensions and NAV2013 dimension sets
Day 14 Add NAV dimensions as your business changes
Day 15 Learning more about dimensions from Microsoft Dynamics Customer Source
BONUS View Convergence 2013 session on Microsoft Dynamics NAV dimensions here
This posting is one of the Top 20 Most Viewed in the last year! Follow this link to see the entire list.
PowerPivot to the People
Posted: March 5, 2013 Filed under: Uncategorized | Tags: BI, Excel, Microsoft, NAV, Office2013, PowerPivot Leave a commentAs a Controller at a small to medium-sized business, I struggle with the big BI question: do I invest in a business intelligence package or do I do it myself?
When I first became aware of PowerPivot, a free Excel add-on that became available with Microsoft Office 2010, I was excited and also a little relieved. While the emergence of PowerPivot didn’t completely solve my dilemma, it sure gave me some significant options for more data accessibility. I didn’t have to depend on my partner or an IT employee with special skills to build me a dataport from NAV, or to piece together an SQL query, or to build a cube I could apply queries to. Because I have PowerPivot, suddenly I can be Super-Controller; accessing tables directly in my NAV database, pulling ginormous amounts of data into a single spreadsheet, and manipulating the data with lightning speed into familiar Excel pivot tables, all without asking for help. 
So, when I read in a recent article from MSDynamicsWorld.com that New Office 2013 Licensing May Put PowerPivot, Power View Out of Reach for Some Microsoft Dynamics Users, I was actually pretty alarmed and then pretty upset. How dare Microsoft give us this shiny new Christmas dream and then snatch it away like some kind of horrible data-reneging Grinch!
I went looking for a few more answers about exactly what was going on, and what I found out was that Microsoft has actually taken PowerPivot out of most versions of Office 2013. This is a big deal because it was previously available in all versions of Office 2010, so Microsoft is actually removing functionality. PowerPivot is only available in Office 2013 if you get Office Pro Plus through volume licensing or through Office 365 subscriptions. Basically, this means PowerPivot is not available in any retail Office 2013 packages, so therefore, is only reachable by companies who have enough purchasing power to utilize volume licensing packages. So, a tool that was designed, in my opinion, to give BI power directly to the people by making it simple enough for financial folks to pull their own data, has now been restricted to only business class licensing. If you’re looking for some interesting theories as to why this might be, read Hey, Who Moved My (PowerPivot 2013) Cheese?
Mr. Excel himself (Bill Jelen), the uberist Excel geek of them all, has some great stuff to say about PowerPivot, including “PowerPivot is the best new feature to hit Excel in 20 years” and a few other things here including a great short video explaining why we should care. I just said in a recent NAVUG Ask the Experts Finance webinar only two weeks ago that as a financial professional who uses NAV, learning to use PowerPivot should be the most important skill finance people should learn in the next year.
Microsoft has missed a huge opportunity to finally settle a score in the BI arena for small to medium businesses by making this move. There has always been the argument that using Excel spreadsheets is a risky proposition for financial professionals. You can really create some big problems for yourself if you are not careful in how you manage your spreadsheets. Some companies even go so far as to outlaw them and attempt to go spreadsheet free. Companies who sell BI packages lean on this pretty hard, trying to remove spreadsheets from the list of available choices.
I say this risk is greatly offset by the benefit of being able to use a tool that can pull, in a safe way, massive amounts of data that can be manipulated by the typical Excel end-user quickly and efficiently. For me, the benefit PowerPivot brings to my company tips the scale on sinking money into a BI solution, and keeps me firmly in the DIY BI camp, with Excel as my primary tool. Making PowerPivot available in all new versions of Excel seals the deal and makes BI in Excel a revolution of equality, ensuring equilateral Excel adoption in the business world.
I’m glad to see so many people bringing forward a call to action to bring PowerPivot back to all versions of Office, not just Pro Plus and Office365 subscriptions. I’m adding my voice, and will continue to ask Microsoft to bring PowerPivot to the people!
This posting is one of the Top 20 Most Viewed in the last year! Follow this link to see the entire list.
Dynamics NAV Financials is now on Facebook
Posted: February 19, 2013 Filed under: Uncategorized | Tags: facebook, NAV, NAVUG, tips and tricks, training, user group Leave a comment You asked for it, you’ve got it! The blog has got its very own Facebook page at www.facebook.com/DynamicsNavFinancials. For those of you who would rather have Dynamics NAV Financials show up in your Facebook feed, come on over to the new page and hit the Like button!
Since the blog’s been running for almost a year, I’m recycling some of the most popular posts so you have something out there to look at other than my smiling face. If you’re curious about any of my travels with NAVUG, and want to see more pictures of me in a conference room waving my arms around and wearing a name tag, come on over to the Facebook page. I’ll keep you updated on where I’m speaking and about what, and will let you know when new classes open up for registration. And of course, all of the great new content will get posted out there every week. 
If you’re more interested in just getting great tips and tricks on how best to use NAV at your job, follow by email from the main blog page, follow me on Twitter, or subscribe to the RSS Feed.
Seriously, thanks for reading. Who would have thought this many people would want to know about this stuff? The fact that people have asked for more ways to get this information is just fantastic. I’ve still got plenty more to say and will keep on sharing as long as people keep on reading!
I’m presenting at Microsoft Dynamics Convergence 2013 in New Orleans!
Posted: February 11, 2013 Filed under: Uncategorized | Tags: Account Schedules, Classic Client, Convergence, dimensions, NAVUG, RTC, user group 1 Comment For those of you who are regular readers at DynamicsNAVfinancials.com, I wanted to let you know I will be presenting at Microsoft Dynamics Convergence 2013 in New Orleans, coming up in March. I’ll be doing a session on Account Schedules on Monday, a session on Dimensions on Thursday, and will be participating in sessions as a panelist for Ask Your Peers: Finance Professionals, as well as Ask Your Peers: Upgrade Experiences. More detailed session descriptions are below and are hosted by NAVUG. If you haven’t yet had the chance to connect with the NAV user group, check out this link on how to get engaged with NAVUG and the Dynamics NAV community at Convergence 2013.
If you’re attending Convergence, I’d love to meet you! Be sure to stop by and say hello!
Account Schedules in Microsoft Dynamics NAV: UBNAV04
Ask Your Peers: Finance Professionals: IDNAV01-R1
Ask Your Peers: Upgrade Experiences with Microsoft Dynamics NAV :IDNAV03
Tips & Tricks for Working with Dimensions in Microsoft Dynamics NAV:CSNAV08
Video Demo: How to export NAV account schedules to Microsoft Excel
Posted: February 5, 2013 Filed under: Uncategorized | Tags: Account Schedules, dimensions, Excel, export to excel, financial statement, learning, NAVUG, NAVUG Academy, training Leave a commentThere are some quick and easy ways to publish NAV Account Schedules to Microsoft Excel but some of them end up with some pretty ugly formatting unless you know a few secrets on how to make them look better. This short demo video shows you how to create a nicely formatted NAV Account Schedule in Microsoft Excel that only requires formatting the first time you set it up. Each time you replicate the report after that, you can simply update the report with new numbers and the formatting will remain the same every time.
While this demo shows how to create a financial report with three monthly tabs, you can easily extend this technique in a couple of different ways. I use this same technique to produce my monthly financial statement package. I have eighteen pages in the package I produce each month, and each page is a different account schedule. When I start a new month, I copy the Excel workbook and rename it with the new month, then use exactly this same technique to produce the new month’s reports. By using this technique, the new copied workbook acts as a “shell” to receive my new numbers. From month to month, I am able to maintain consistent formatting in my reporting while producing my financial reports in the most efficient way possible. I can apply the same principles to my monthly team budget reports. In this case, I can produce the same actual versus budget report over and over with a new dimension filter applied for each team, one per each Excel worksheet in the workbook.
If you’d like to learn more about account schedules, please visit my 2013 Classes page. This short video demo comes from my Account Schedules Basics class which I teach through NAVUG Academy. This class offering is just one of many classes that are being offered by NAVUG Academy in 2013 to help you get more out of your use of NAV at your company.
This posting is one of the Top 20 Most Viewed in the last year! Follow this link to see the entire list.
NAVUG in Rome!
Posted: January 31, 2013 Filed under: Uncategorized Leave a comment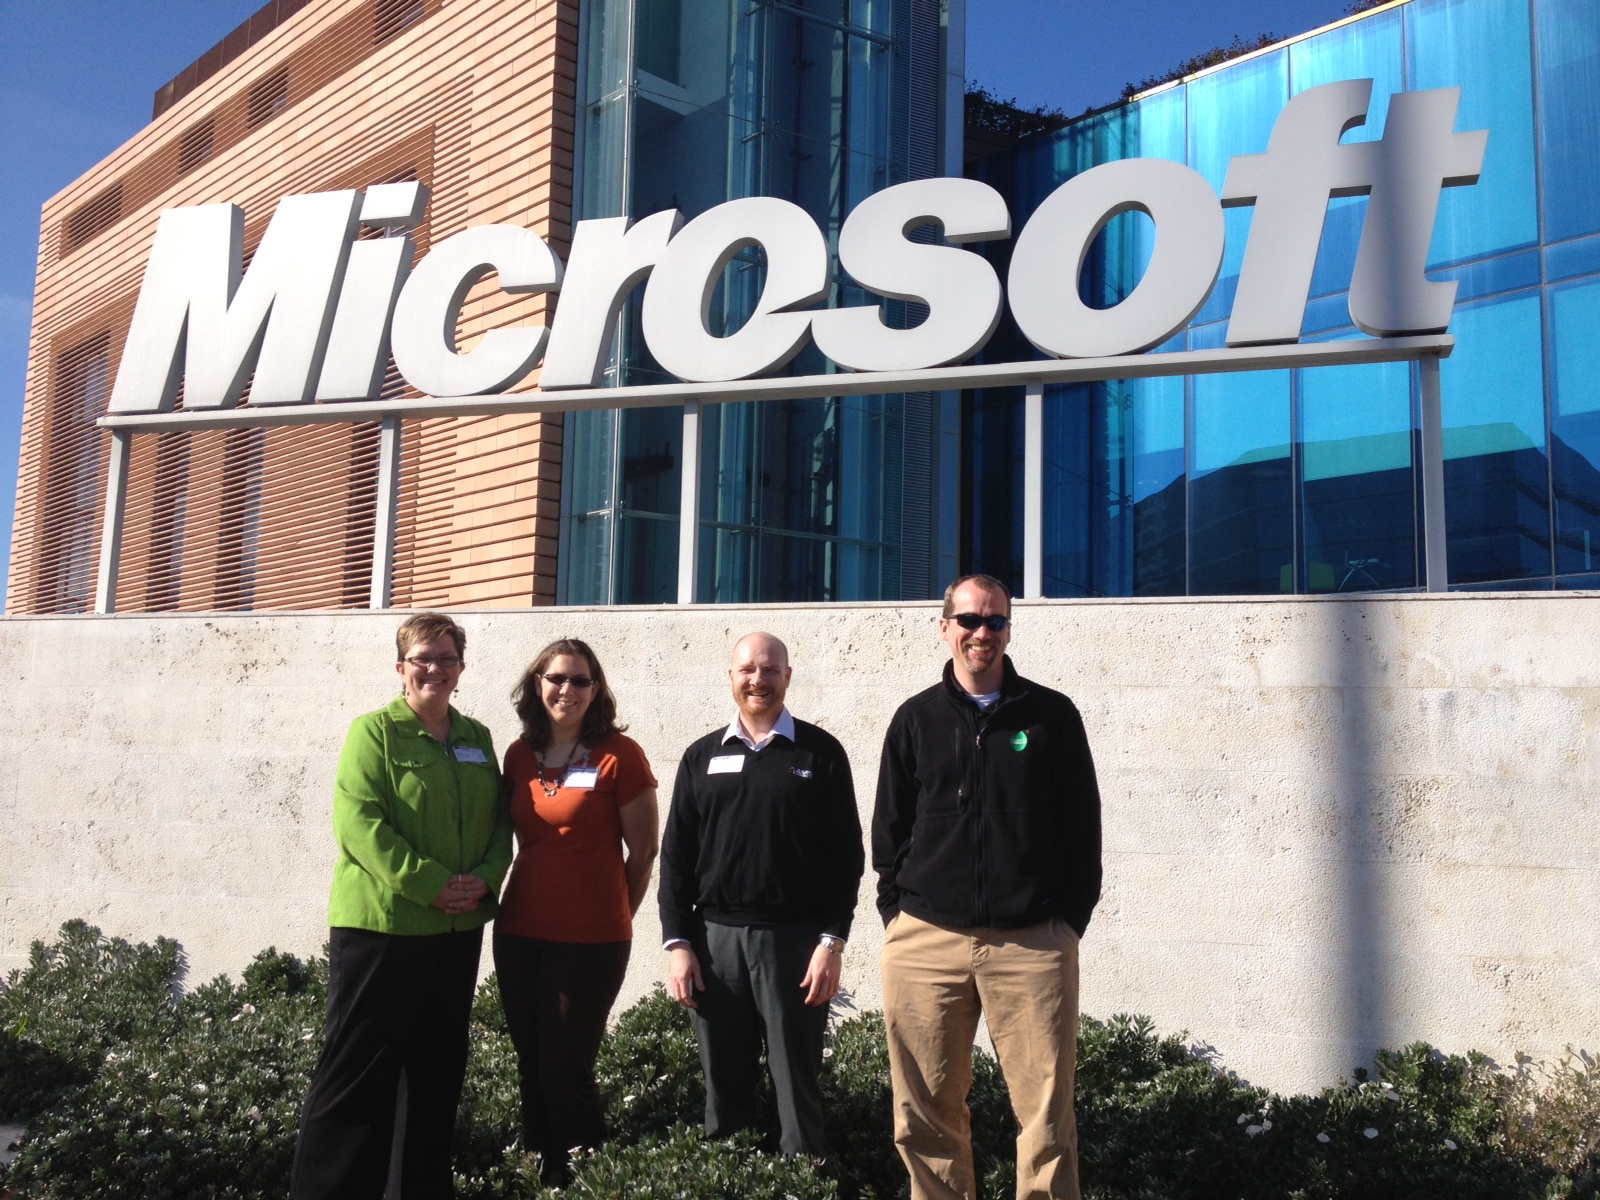 Representatives of NAVUG got the opportunity this week to travel to Italy for The NAVUG Event – Rome 2013 to meet other international NAV user groups, partners, vendors, and end users. In a quick couple of days, these groups got to participate in many activities including speednetworking, educational sessions, round table discussions, and ask the expert panels. NAV users from Germany, Denmark, Italy, Kenya, and other countries got the chance to connect, learn and share together at the Microsoft offices located in Rome, Italy.
Shown in the picture in front of those offices are Kerry Rosvold (Augsburg Fortress Publishers), Trish Boccutti (Dynamic Communities), Marc Allman (AMS Controls), and Jason Chance (Seventh Generation). The NAVUG group had the privledge of presenting and facilitating sessions on Data Warehousing, Upgrading Tips and Tricks, Finance 101, Database Optimization, Manufacturing, Supply Planning, and Reporting Architecture.
Looking for a how to guide on running the year end close in NAV? Here are 3!
Posted: January 22, 2013 Filed under: Uncategorized | Tags: CustomerSource, general ledger, manual, NAV, year end close Leave a commentAll your journal entries are done, all of your modules balance to the general ledger, and your inventory period is closed. You are ready to get that income statement rolled up and close the year. Now where were those instructions? It’s not unusual to be a little unsure about the year end close process – we only get to do it annually, so no one will blame you if you can’t remember exactly what you did last year, and in what order. Here are a couple of resources to help you out.
ABC Computers, Inc. has a nice entry on their technology blog, “How to Close a Fiscal Year in Microsoft Dynamics NAV: Instructions for Annual Closing Operations“. This goes through a quick top level summary and then a deep dive into the closing process with field by field instructions.
If video learning is more your style, Archerpoint has a short 3-4 minute video out there, “Closing the Fiscal Year in NAV” that shows the annual closing process screen by screen.
 Finally, you can always get the full manual on the year end closing process straight from Customer Source. Log in and type in 80041 into the search box. This will get you directly to the “Finance in Microsoft Dynamics 2009” Microsoft course. Download the course and go straight to the file for Chapter 10 – Year End Closing Processes.
Remember, you can always make entries after you’ve gone through your initial income statement rollup. You don’t need to wait for that very last entry to get this process going.
")

