5 reasons you need to use NAV dimensions (part 2 of 15)
Posted: March 12, 2013 Filed under: Uncategorized | Tags: accounts payable, dimensions, financial statement, general ledger, NAV, tips and tricks 1 Comment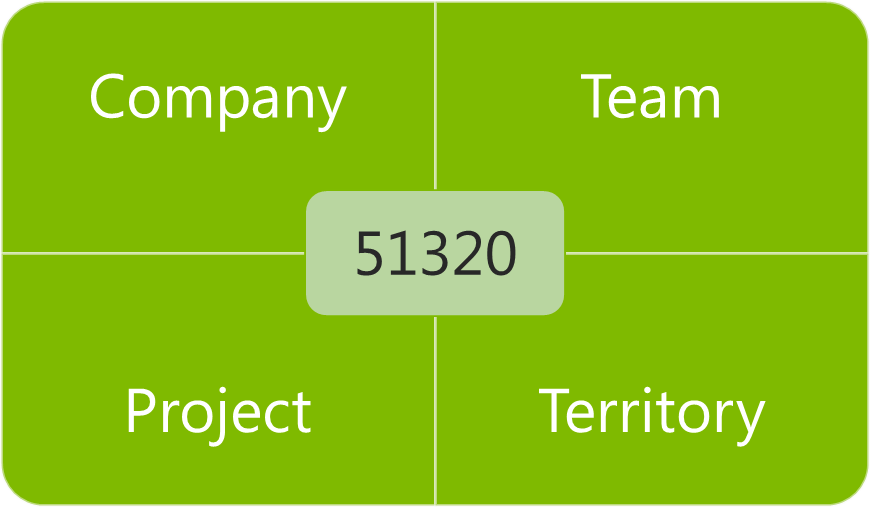 Still not convinced that leaving your old multi-segmented chart of accounts behind is a good idea? Don’t know exactly what in the world that crazy grid illustration with a number in only one box and words in the rest has to do with accounting, at all? Here are my five reasons for why you should be using dimensions.
1) Your chart of accounts is shorter. Seriously now, my company was the one with the 4,000 accounts in the chart of accounts before we installed NAV. We used project codes heavily, and had three to four segments to each base general ledger account number. Every member of the accounting team had this gigantic dog-eared book on their desk they would reference as they went through their day. Not only was it impossible to remember all that detail, it took a long time to type those numbers into the system, and with so many manually entered numbers, it was very easy to make a mistake. We spent a full two days every month during the close investigating and researching whether things went into the right place and then constructing reclassifying entries to correct the errors. My chart of accounts is less than 200 accounts now, and we eliminate a few more every year.
2) Account coding becomes intuitive. We still use project codes heavily, but now we’re able to give them a name as well as a number, which makes the coding process much more intuitive, less prone to error, and allows people outside the accounting department to enter data into the system. We work with a lot of non-numbers people at our company, and just talking about money has become easier since we started using dimensions. Nobody needs to get out the big dog-eared book to “determine the coding for your recent T&E”. We can use actual English and say things like, “Code that expense report to the Marketing team for the recent children’s sunday school event in Ohio” and everyone knows where that will be coded when the invoice gets entered to NAV.
3) Better control and accuracy. Certainly with having more intuitive coding and a shorter chart of accounts, we should all see some improvement in control and accuracy of postings. But wait, there’s more! NAV does a fantastic job of layering in more features for dimensions like allowing automatically populated default values, adding warning messages to make sure you get the right kind of dimension in the right place, allowing control at the level of your master data as well as your chart of accounts, and allowing restrictions on what dimensions can be combined with other dimensions and with what priority. All of these features combine to make sure the computer does the work instead of your employees and does it more accurately. Remember those two days my company used to spend to review and correct entries with reclassifications? Last year, I was able to send out an email out for three month end closes letting my team know they had a perfect posting month – no errors – not a single reclassification.
4) Greater flexibility in your reporting. Even with this shorter chart of accounts, we actually have more detail than we had before, because getting more detail through use of dimensions makes it possible. The idea of adding another segment in the old system to support a changing reporting need was heinously prohibitive. With dimensions, we gain that flexibility without adding another 400 pages to our chart of accounts. We produce more reports with more valuable information now than ever before, and we have the ability to combine the data we’ve gathered in more flexible combinations to assist us in making business decisions.
5) You’ll continue to have more options, even after go-live. I think a lot of people believe the only time they can make decisions about dimensions is when they are initially implementing. While this is a very important time to lay the foundation for your NAV system, you do have the option to add or change dimensions as you go along. We’ve actually added about one new dimension annually, as our business needs have changed, and as we’ve determined we need to report on different priorities.
Keep reading this month as we continue our series, 15 Days of NAV Dimensions.
15 days of NAV dimensions
Posted: March 11, 2013 Filed under: Uncategorized | Tags: Account Schedules, Convergence, CustomerSource, dimensions, Dynamics, NAV, NAV 2013, tips and tricks 1 CommentMarch Madness may mean basketball for some folks, but for me it means Convergence! Getting a chance to participate as a speaker at Microsoft Dynamics Convergence is a great opportunity to meet new NAV users I haven’t met before. I’m always looking to expand my network of knowledgeable professionals, and one of the ways I do that is by sharing information.
I’m lucky enough to be giving a concurrent session this year called Tips & Tricks for Working with Dimensions in Microsoft Dynamics NAV and I thought I would put together a series for the blog on the same topic to get the information out to a wider audience. For the next 15 days, there will be a brand new post on one of these dimension topics. Enjoy!
Day 1 4 questions to ask when deciding how to use NAV dimensions in your business
Day 2 5 reasons you need to use NAV dimensions
Day 3 The finance professional’s perspective on NAV dimensions
Day 4 Why finance and IT need to work in partnership on a NAV dimension strategy
Day 5 Viewing NAV dimensions on postings: where can you see them?
Day 6 NAV default dimensions and value postings applied to master data
Day 7 NAV default dimensions and value postings on the chart of accounts
Day 8 NAV dimension combinations for additional accuracy
Day 9 NAV dimension priorities
Day 10 Resolving NAV dimension errors
Day 11 NAV dimensions in account schedules
Day 12 NAV dimensions in budgets and consolidations
Day 13 Communicating to IT about NAV dimensions and NAV2013 dimension sets
Day 14 Add NAV dimensions as your business changes
Day 15 Learning more about dimensions from Microsoft Dynamics Customer Source
BONUS View Convergence 2013 session on Microsoft Dynamics NAV dimensions here
This posting is one of the Top 20 Most Viewed in the last year! Follow this link to see the entire list.
Dynamics NAV Financials is now on Facebook
Posted: February 19, 2013 Filed under: Uncategorized | Tags: facebook, NAV, NAVUG, tips and tricks, training, user group Leave a comment You asked for it, you’ve got it! The blog has got its very own Facebook page at www.facebook.com/DynamicsNavFinancials. For those of you who would rather have Dynamics NAV Financials show up in your Facebook feed, come on over to the new page and hit the Like button!
Since the blog’s been running for almost a year, I’m recycling some of the most popular posts so you have something out there to look at other than my smiling face. If you’re curious about any of my travels with NAVUG, and want to see more pictures of me in a conference room waving my arms around and wearing a name tag, come on over to the Facebook page. I’ll keep you updated on where I’m speaking and about what, and will let you know when new classes open up for registration. And of course, all of the great new content will get posted out there every week. 
If you’re more interested in just getting great tips and tricks on how best to use NAV at your job, follow by email from the main blog page, follow me on Twitter, or subscribe to the RSS Feed.
Seriously, thanks for reading. Who would have thought this many people would want to know about this stuff? The fact that people have asked for more ways to get this information is just fantastic. I’ve still got plenty more to say and will keep on sharing as long as people keep on reading!
Tips and tricks for a flawless budget load in NAV
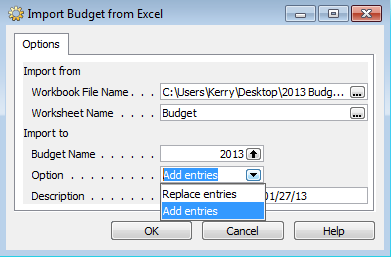
Posted: January 21, 2013 Filed under: Uncategorized | Tags: budgets, Excel, export to excel, NAV, tips and tricks 1 CommentHopefully, you’ve completed your budget work for 2013 and all you need to do to finish is to load all that information to NAV so you can begin to report against your actual financial numbers. If you’ve done this before, you might already know that NAV’s budget tool can be a bit fussy and also a bit cryptic about why it won’t accept your carefully prepared data. Here are four quick tips to help you with getting that data into NAV quickly, correctly, and in one try.
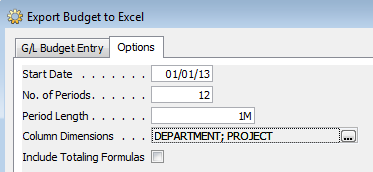
1. Export first, then import. This is the single most important detail about getting budget data loaded into NAV. You can choose to export an existing budget or even choose to export a blank new budget. Exporting a budget as your first step establishes a working template you can populate your data into, including dimensions. As long as you start with this template, you are already most of the way there to a successful NAV budget load.
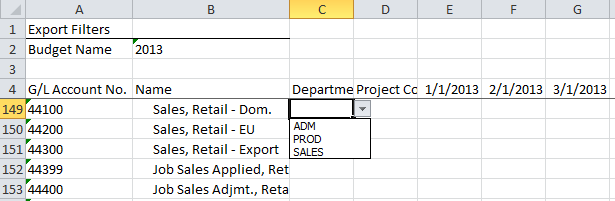
2. If you’re using dimensions, validate your data against the provided drop downs. Make sure all budget lines that use dimensions are only using valid dimension names. Any deviation from the allowable values that already exist in NAV can cause your budget load to error out or load without balancing.
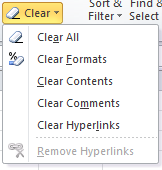
3. Clear the formats from your numbers. Once you’ve copied and pasted or typed your numbers into your Excel template, use the Excel “Clear Formats” function on all cells that contain a numeric value to make sure they are all returned to a formatted status of general. NAV does not accept any other format than the one in the template, and use of other formats, including use of commas in the numbers, will cause the budget tool to give an error and keep you from loading your budget successfully.
4. Use the “Add Entries” option for a brand new budget load and the “Replace Entries” option for a subsequent version. The add entries option should only be used for a brand new budget load, otherwise the entries will be added on top of the already existing entries, doubling or tripling them. If you need to load a second or third version or some type of correction, always use the replace entries option instead of the add entries option. If you really get stuck with a bunch of errors, the best thing you can do is delete your budget and reload from scratch.
Take one last look through your data to make sure it’s accurate and exactly what you expected. You can use the budget tool to do this, or even better, put together a quick account schedule that shows your entries using “G/L Budget Entries” instead of “G/L Entries”. Make sure to look at your total balances, balances by fiscal period, and balances with dimension filters applied. Once you’re satisfied that all your budgeted data has loaded correctly and completely, you’re ready to produce financial reporting showing actual versus budgeted numbers!
This posting is one of the Top 20 Most Viewed in the last year! Follow this link to see the entire list.
Use show opposite sign to reflect net income correctly on an income statement using NAV account schedules
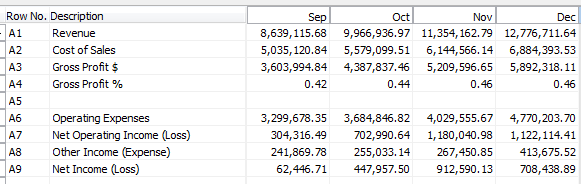
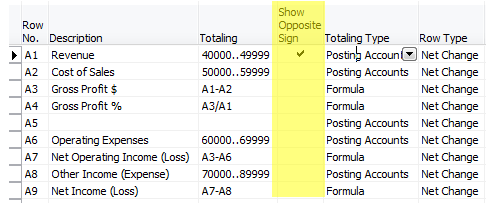
Posted: December 11, 2012 Filed under: Uncategorized | Tags: Account Schedules, accounting, financial statement, income statement, net income, show opposite sign, tips and tricks, two consecutive operators Leave a commentOne of the concepts I see students in my NAV account schedules class get stuck on is exactly how to use the show opposite sign function when constructing an income statement. It can be a bit mysterious why it behaves the way it does, and it seems to defy the rules of accounting and basic arithmetic all at the same time. Once you understand why it works the way it does, you’ll know how to use it in the future. From the example shown here, we see a very basic income statement.
Without using any numbers yet, let’s all agree on some basic calculations:
Revenue – Cost of Sales = Gross Profit $
Gross Profit $ / Revenue = Gross Profit %
Gross Profit $ – Operating Expenses = Net Operating Income (Loss)
Putting these basic calculations into the design view for this account schedule gives the result below. Notice we’re not going to use the show opposite sign function yet, or make any changes to the basic formulas we just defined.
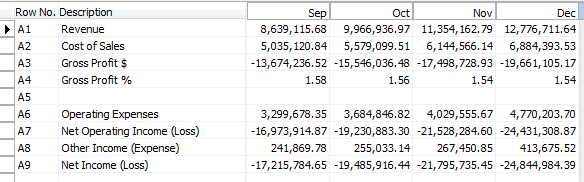
When we look at the report view for this account schedule we see that we’ve got a significantly wrong result. The revenue is showing as a negative number and all of the calculations below it are incorrect.
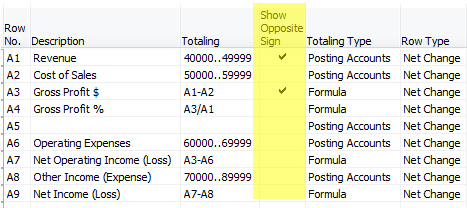
Now, for the accountants out there, you may already have guessed what the problem is. When accounting for revenue, these numbers are assigned a credit value, which shows up as a negative. Most financial statement end users want to see this reflected as a positive number. This is where we need to use show opposite sign. Let’s add that in to the design view, as shown below.
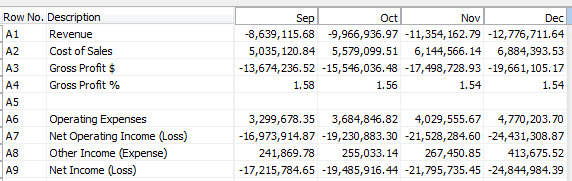
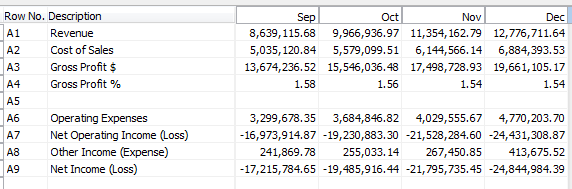
When we look at our new result, you would think all would be correct. We’ve corrected the accounting problem by flipping the sign. However, when you look at the result, we get the following.
Why in the heck is that gross profit number not right? It seems we’ve got very simple math we’re dealing with here, what could be the problem? Many folks at this point go for the simple solution – just select show opposite sign on the gross profit $ line.
Unfortunately, this doesn’t work either, because you are flipping the sign on both the revenue value as well as the cost of sales value and you simply get the opposite of the same wrong number you got above.
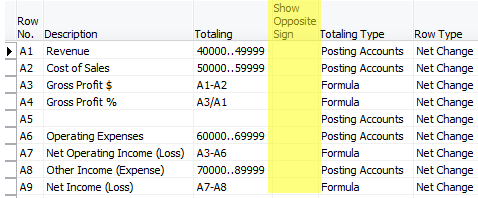
The reason this is happening is because the show opposite sign function is doing exactly what it says it is doing, it is SHOWING the opposite sign. This is really only a presentational mask, and when calculations are done against the value, revenue is still calculating as a negative number, even though it appears on your report as a positive number. This little bit of arithmetic defying programming can make an accountant a little cranky, but it is easy to solve with a little mathematic trickery. In order to fix this, we need to put into place a two part solution. The first part we already know; we must select show opposite sign for our revenue accounts. The second part manipulates the Gross Profit $ and Gross Profit % as shown below, changing the value of the revenue account within the equation in order to calculate correctly.
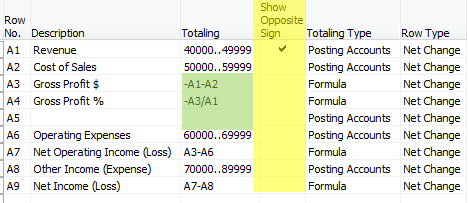
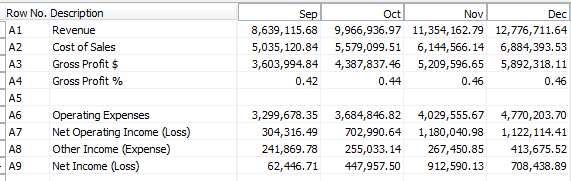
The end result gets us correct results every time.
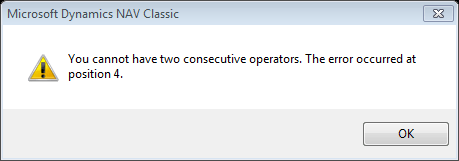
For those of you who are really paying attention, there is one more math mystery in the show opposite sign puzzle. Why have I chosen to show the calculation for Gross Profit % as -A3/A1 instead of simply using A3/-A1? Again, we’ve got to defy the programming with math tricks. Choosing A3/-A1 gives the error shown below. Get around it by moving the negative value to the other side of the equation and you’re good to go.
This posting is one of the Top 20 Most Viewed in the last year! Follow this link to see the entire list.
Aging methods in NAV – which buckets are you looking for?
Posted: October 30, 2012 Filed under: Uncategorized | Tags: accounts payable, accounts receivable, aging, aging method, bucket, document date, due date, invoice date, NAV, overdue, payment terms, posting date, tips and tricks, transaction date Leave a comment When running any type of financial report, it’s important to ask the right question in order to get the right answer. When running your accounts payable or accounts receivable aging reports, it’s especially important since there are three available options that will give you the same total answer but will break your transactions down into different aging bucket categories. Choosing the correct option for the question you actually want to answer is the key.
Question #1: How overdue is the invoice?
By choosing the Aging Method of Due Date, you are asking NAV to age each bucket on your aging in intervals based on the Due Date of the invoice. Remember the due date is based on a calculation that applies payment terms against the document date of the invoice.
Question #2: How many days have passed since the invoice was posted?
By choosing the Aging Method of Transaction Date, you are asking NAV to age each bucket on your aging in intervals based on the Posting Date. This is sometimes confusing to new users since on both the purchase and sales invoice forms, the two available dates are posting date and document date. The posting date should always be the date you want to post the invoice to your books and therefore the fiscal period the invoice will report in. For the purposes of your aging reports, posting date is equivalent to transaction date.
Question #3: How many days have passed since the vendor billed us – or – since we billed the customer?
By choosing the Aging Method of Document Date, you are asking NAV to age each bucket on your aging in intervals based on the Document Date. This one makes a little more sense to folks because at least the terms are the same. But darn us accountant types, we often call the document date the invoice date when we’re referring to it. Basically, this date should be the date your vendor has provided on the invoice, or from the customer side, the date you shipped and therefore the date you provided on the invoice to the customer. Any payment terms defined on the account will use the document date to calculate the due date.
An example of two invoices shown with all three aging methods
In a perfect world, our posting dates and document dates would all be the same. Let’s pick a perfect example with posting date of 11/01/10 and document date of 11/01/10 and payment terms of Net 21. This would calculate a due date of 11/22/10 on this invoice.
Then let’s pick an imperfect example. Let’s pretend someone at our company turned in that 11/01/10 invoice sometime in December, after the November books were closed. We still need to book this late invoice, so we’ll choose a posting date of 12/01/10, but since it was not the vendor’s error, we’ll use their invoice date of 11/01/10 in order to calculate the payment terms correctly.
Now, let’s look at an aging as of December 15th, 2010, all three ways. Take note that for all three methods, the balance due is exactly the same. The differences appear in how the aging buckets are defined and how transactions age into the different buckets.
Aging Method of Due Date
Key difference here is the aging buckets start calculating at the due date, so you’ll see column headers of current, up to 30 days, 31-60 days and over 60 days only when using this aging method.

Aging Method of Transaction Date
This aging is based on the posting date, the date that corresponds to the fiscal period you posted the invoice in. Note the late invoice with a 12/1/10 date shows as current.

Aging Method of Document Date
This aging has the same buckets as the one run with transaction date, but is based on the document date or invoice date.

This posting is one of the Top 20 Most Viewed in the last year! Follow this link to see the entire list.
Tis the (Budget) Season! Three handy NAV account schedule tips to get you through
Posted: October 23, 2012 Filed under: Uncategorized | Tags: Account Schedules, budgets, column layout, NAV, row setup, tips and tricks Leave a comment I don’t know about your company, but my company is in full budget preparation mode. We’re working on getting our sales forecast and operating budgets put together in time for the end of year. Like most companies, we’re working on this predictive tool while we’re in the midst of finishing out the year, so of course, we get to make a few assumptions on how the year will end up. I don’t have a crystal ball, but I do have some pretty great account schedules that help folks at my company get a good solid look at where we ended up last year, what we planned for this year, and how we’ve done over a couple of years, and I’m going to share those three account schedule column layouts with you today. Hopefully these simple setups will give you some quick ways to wow your company and make their budget construction process easier.
Tip 1: Show 12 months of actual data
We ask our budget managers to give us a twelve month prediction, why shouldn’t we give them twelve months of data to work with? No matter what month you’ve just closed, you can quickly put together an account schedule that shows all of the completed months for the year (in this case, January-September) as well as October/November/December of the prior year. This way, if your activity is generally the same year over year, budget managers can get a quick gauge from this setup. Keep in mind this column layout isn’t dynamic, so it’s not a true rolling twelve months. For budgeting purposes, it’ll get you what you need.

Tip 2: Show 9 months of actual data and show what the plan is for the last three months of the year
Another way to provide a projection for the year is to show all the completed months for the year (again, January-September) and then show the budgeted plan for October/November/December. This method shows actual activity as well as three months of planned activity in order to project the total for the year. If activity this year is significantly different (higher or lower) from the year prior, you might depend on this view instead.

Tip 3: Show a whole bunch of history at a high level
Especially for sales forecasting, it sometimes gets difficult to look at too much data at once. One way to get past data analysis overload is to provide a few years’ worth of annual data. This column layout will give four years of data, helping you to compare not only year over year, but multiple year trending in your data.

All three of these tips should give you a few additional tools to help you make sense of a whole lot of data. They can be applied to almost any row setup you have whether that setup is related to revenue or expenses. If you’re looking for more formulas, visit the account schedule formulas page.
Happy Budgeting!
This posting is one of the Top 20 Most Viewed in the last year! Follow this link to see the entire list.
Challenge to the NAVUG Community: NAV Account Schedules formulas cheat sheet
Posted: October 15, 2012 Filed under: Uncategorized | Tags: Account Schedules, challenge, cheat sheet, formulas, NAV, NAVUG, NAVUG Academy, tips and tricks, user group Leave a comment I had the opportunity today to teach a full day class on account schedules to an amazing engaged group of people! I get the privilege of doing this in person once a year at NAVUG Forum thanks to NAVUG Academy. In the last year, I’ve branched out to teach this same class in webinar format, and boy has it been a blast. The number one question I get is, “Do you have a cheat sheet for all the formulas you can use in Account Schedules?”
I’ve shied away from this in the past, because it’s a complex question. You’ve got to take into account comparison period versus comparison date, column type used, use of filters, and like all Microsoft products, there is often more than one way to accomplish the same result. But I think I’ve got us a start with the page I’ve just put out on my blog.
I believe the power of community is an amazing thing. We continually make each other better by sharing information.
I CHALLENGE YOU TO SUBMIT A COMMENT WITH AN ACCOUNT SCHEDULE FORMULA THAT’S NOT YET BEEN LISTED.
As long as I can test it to prove it works in the way described, and it’s different enough from already listed formulas, I’ll add it to the list and make sure to put a shout out to the contributor on the blog.
I’m looking forward to seeing what our amazing NAVUG community can accomplish!


The NAV accountant’s little helper: the reconciliation account check box
Posted: September 18, 2012 Filed under: Uncategorized | Tags: balance after posting, Classic Client, general ledger, journal entry, NAV, net change, posting test report, reconciliation account, RTC, tips and tricks Leave a commentThere’s a tiny feature in NAV that I take for granted. It’s there, in the background, hiding in the setup, and it helps me out just a little almost every time I make a manual journal entry. Especially if I’m in a bit of a rush, or distracted, this option gives me one more quick but effective look at what I’m doing before I commit a journal entry to my books permanently. This nifty little thing can be added to your NAV setup at any time without any help from IT and won’t require any maintenance. The option I’m talking about is the Reconciliation Account check box you can find on your general ledger account card. Here’s where you can find it:
Role Tailored Client

Classic Client

For any account where you’d like this additional double check, check the Reconciliation Account box found on the General Ledger Account Card. Now go put together your journal entry.

Instead of posting directly from the entry, choose Actions=>Posting=>Test Report=>Preview (if you’re RTC) or just choose Posting=>Test Report=>Preview (if you’re Classic). NAV will put together a handy dandy print preview which will now include a section at the bottom labeled Reconciliation. This little section will show you which direction your entry is going in, what sign your ending balance will be, and what the actual balance after posting will look like. This all happens before you commit it as final to the system. This may be just the extra bit of help you need in order to keep you from making an error. If you like what you see, post that journal entry!

If you have an account where you’ve got a lot of daily activity, you may not find this as useful as you do with accounts with just a little bit of activity throughout the month because you’ll have a more frequently changing end balance. Decide what might be useful to you.
Next time you do a journal entry, give it a try. Go to the account card and check the box. Make your journal entry. Before you post, run the posting test report. Is the net change in your journal entry going in the right direction? Did you enter the correct account? Is your ending account balance the right sign? Most importantly, is the balance after posting what you expected? This little helper can give you a quick preview before you hit post and save you from having to reverse and correct an entry.
This posting is one of the Top 20 Most Viewed in the last year! Follow this link to see the entire list.
10 easy tips for payment terms success in Microsoft Dynamics NAV
Posted: September 13, 2012 Filed under: Uncategorized | Tags: accounts payable, accounts receivable, aging, customer, discounts, document date, due date, Dynamics, immediate, invoices, Microsoft, NAV, payment terms, suggest vendor payments, tips and tricks, vendor Leave a comment1.  Know that the Document Date is what controls the calculation of payment terms. This is true for both vendor invoices as well as customer invoices.
2. The vendor and customer areas share the same Payment Terms setup. Make sure the folks who maintain these tables know they’ll need to share the codes that are set up here.
3. Basic terms use very basic setup. Payment terms of Net 30 simply require a Due Date Calculation of 30D in order to work.
4. Immediate payment terms can be accomplished in two ways. The first way is to leave the payment terms field blank on the vendor or customer card. When this occurs, NAV makes the assumption that the payment terms are immediate. The second way is to populate the Due Date Calculation with 0D. By putting in zero days, you can still define a payment term and name it as immediate. I don’t like to see blank fields in any of my data, so I recommend using this method.
5.  Discounted terms follow a specific combination in the payment terms table. For discounted terms like 1/10 Net 30 (one percent discount if paid in ten days, otherwise due at thirty days), use this setup.
6. You may have some things you always pay on the first of the month, like rents. How do you get invoices to show up on your payables aging on the first day of the month regardless of whether the month has 31, 30, or 28 days? In the due date calculation, use this simple formula: CM+1D.
7. If you send checks, and you need for that first of the month payment to get in the mail in time to be received on the first, get a little fancier with the formula and use CM-3D. This will calculate the due date as the third to last day of the month, no matter how many days are in the month.
8. If you need to date something as always due the last day of the month, set up the Due Date Calculation as D31. This will always calculate the due date on the last day of the month, regardless of how many days the month has.
9. When running the suggest vendor payment process for payables, the last payment date corresponds to the due dates calculated by the payment terms. The date you put in this field will suggest payments to be made with due dates up to and including the date listed.
10. If any invoice gets posted with incorrect payment terms and you need to correct the due date in order for it to show up properly on your aging, you can go in and correct the due date on the already posted invoice. This can be done from the end-user level and does not require use of the object designer. Drill down to the correct invoice record from the Balance ($) field found on the general tab of the vendor card. Use a triple-click with your mouse on the due date field to change the date quickly and easily. The same steps can be accomplished from the customer card.
This posting is one of the Top 20 Most Viewed in the last year! Follow this link to see the entire list.
")

