NAV AS 101 Lesson 11: Filtering
Posted: May 15, 2014 Filed under: Uncategorized Leave a commentThe primary difference between account schedules in Classic versions of NAV (NAV2009 and prior) and Role Tailored versions of NAV (NAV2009 and later) is mostly navigational. Most of the ways we construct row setups and column layouts have remained the same, but getting around the software is significantly different. Filtering is one of the areas where we see this the most.
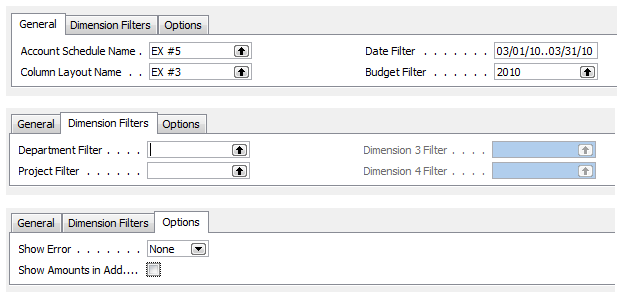
When filtering an account schedule in Classic versions, you have some very basic options to select your dates, budget, dimensions, and very little else.
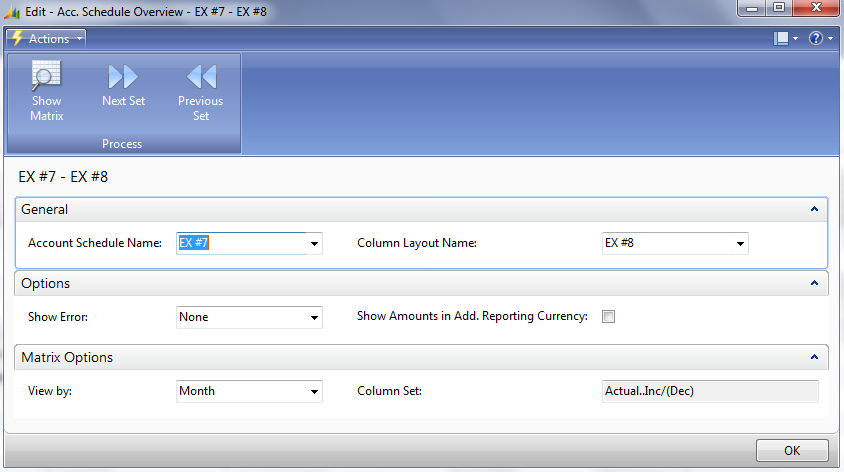
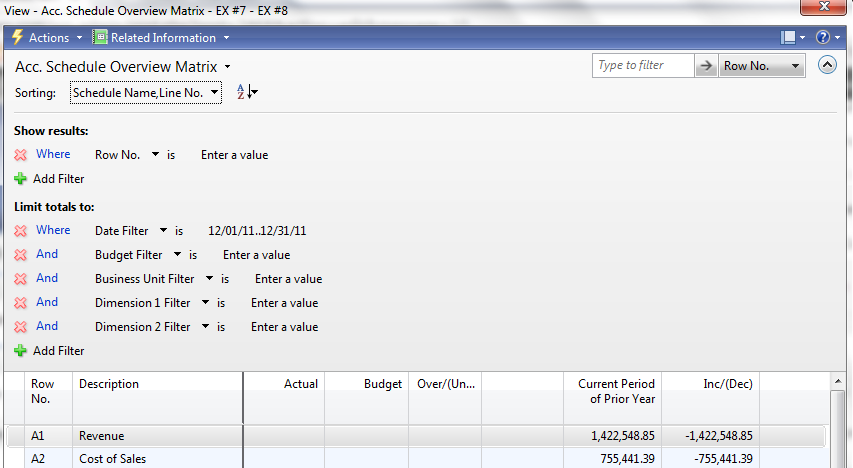
When filtering an account schedule in Role Tailored versions, you’ve suddenly got a whole new world of possibilities. 2009RTC makes things a little complicated, making us move through an additional screen on our way to the account schedule overview before we can apply additional filters once we get there. This has been my least favorite iteration of account schedules filtering because so many of the filters reset when you leave the screen, requiring you to continually redefine them when you come back or cheat the system by changing the work date in order to keep your sanity.
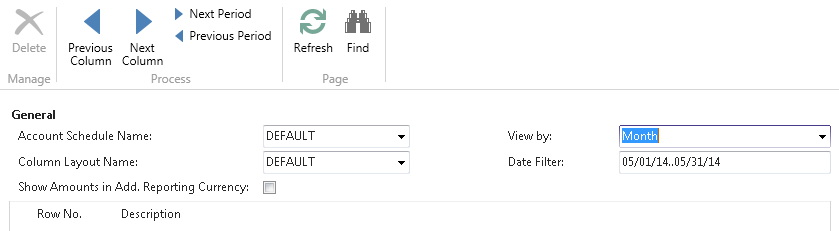
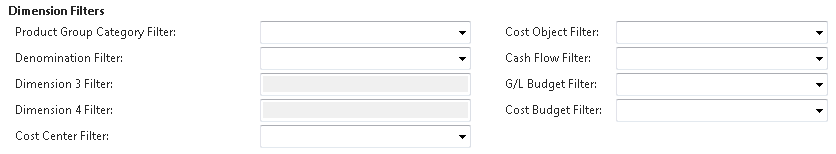
NAV2013 makes it all better with some great improvements and overall simplification. The new filtering eliminates the additional screen on the way to the overview, taking us directly there instead. The filtering is a nice improvement, keeping the frequently changed options up top and the set and forget filters on the bottom. The most important thing of all is that the next period and previous period buttons are back, allowing you to quickly change periods without having to type the full date in.
A nice new feature that lurks in the background are the previous and next column buttons. You’ll think you’ll never need them until you have an account schedule set up with more than 12 columns. The new freeze pane option is nice, but it decreases the number of columns available in your view. Use the shiny new next column button to see the rest of the info you need.
This posting is part of the NAV Account Schedules 101 series. Find the entire list of lessons here.
Don’t forget to visit the Account Schedule Formulas and Account Schedule Examples pages if you’re looking for even more ideas on how to improve your financial reporting using account schedules with Microsoft Dynamics NAV.
You’ve only got six weeks until June 30th. Who cares?
Posted: May 15, 2014 Filed under: Uncategorized 1 CommentYOU should! June 30th is the early bird registration deadline for NAVUG Summit, held this year in St. Louis, MO from October 14-17. There is no single other conference I can possibly recommend more than NAVUG Summit for NAV users. Every year as we go through the process of preparing great content to share with conference attendees I am amazed at the deep passion all of the conference organizers show when constructing the session schedule. I’ve been attending this conference for seven years now, and speaking for six of those years, and I can tell you this year is already shaping up to be the best year yet.
If you’re looking to learn more about NAV from other experienced NAV users, to deepen your professional skill set with new knowledge that is directly applicable to your work, and to network with people who use the same software in their jobs that you do every day, NAVUG Summit is the one event you need to attend this year.
You’ve got six weeks left to save $200 before the registration goes up. Make your list of what you need to learn and who you need to meet. Prepare your arguments to attend this incredibly valuable conference. Talk to your coworkers about why they should come with you. Get registered.
I wouldn’t miss it. You shouldn’t either. See you there!
NAV AS 101 Lesson 10: Comparison Period v. Comparison Date
Posted: May 14, 2014 Filed under: Uncategorized Leave a commentNAV Account Schedules uses a curious convention to determine periods of time in the column layout. The default option if you open account schedules for the very first time is Comparison Date, but I always recommend NAV users use the other option, Comparison Period. Let’s talk about why.

Comparison Period is more flexible
If you read the NAV help on this topic you’ll find a fairly long listing of what you can do with comparison period and a very short entry on what you can do with comparison date. That’s because you can just do a lot more with comparison period. Comparison dates use standard NAV date formulas that are really more appropriate for use in payment terms and journal entries.
I’ve copied both entries below, directly from the NAV help menus, for easy reference.
Comparison Date Formula Field
This field contains a date formula that specifies which dates should be used to calculate the amount in this column.
The program uses this formula to calculate the amount from the comparison period in relation to the period represented by the date filter on the report request.
For example:
|
-1Y |
Same period 1 year earlier |
Comparison Period Formula Field
This field contains a period formula that specifies which accounting periods should be used to calculate the amount in this column. An accounting period does not have to match the calendar, but each fiscal year must have the same number of accounting periods, even though each period can be different in length.
The program uses the period formula to calculate the amount from the comparison period in relation to the period represented by the date filter on the report request. The comparison period is based on the period of the start date of the date filter. The abbreviations for period specifications are:
|
P |
Period |
|
LP |
Last period of a fiscal year, half-year or quarter. |
|
CP |
Current period of a fiscal year, half-year or quarter. |
|
FY |
Fiscal year. For example, FY[1..3] denotes first quarter of the current fiscal year |
Examples of formulas:
|
<Blank> |
Current period |
|
-1P |
Previous period |
|
-1FY[1..LP] |
Entire previous fiscal year |
|
-1FY |
Current period in previous fiscal year |
|
-1FY[1..3] |
First quarter of previous fiscal year |
|
-1FY[1..CP] |
From the beginning of previous fiscal year to current period in previous fiscal year, inclusive |
|
-1FY[CP..LP] |
From current period in previous fiscal year to last period of previous fiscal year, inclusive |
Comparison Period reduces the possibility of accidentally reporting incorrect numbers
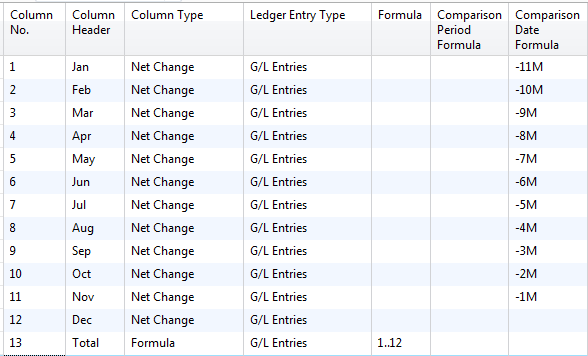
This is a classic example of an account schedule I see in use all the time by beginning account schedule users. Here is a 12 month net change column layout design using Comparison Date.
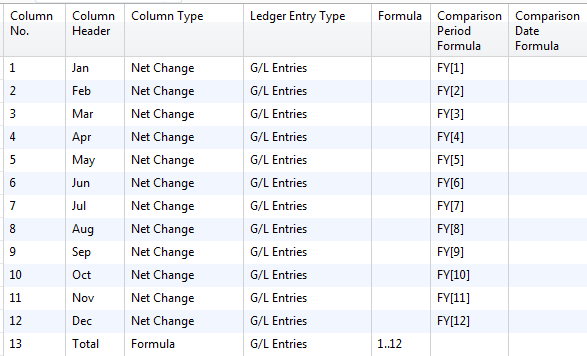
Here is a 12 month net change column layout design using Comparison Period.
The primary difference between the two methods is that comparison period fixes the fiscal periods when you report and comparison date is wholly dependent upon what your date filter is set for.
If you are producing your financial statement package at the end of the month, you’ll produce your income statement, balance sheet, statement of cash flows and any other reports you use with the date filter set for the end of the month you are reporting against. When you get to this report, using comparison date, you’ve got to remember to manually switch your date filter to the end of the year, because the formulas calculate backward from the date set in order to produce the report.
This is very risky because if you forget to do this, you can very easily forget to not switch the date. In this case, the report will still produce 12 columns of numbers, but they’ll be wrong, because they are using the date from your date filter as your “year end” date, which is incorrect. When using the comparison period setup in the way shown above, you can change your date filter all you want within the current fiscal year and you’ll get the same correct result every time.
If you use an accounting period other than calendar month, you’ve got to use comparison period
You just can’t use comparison date if you’ve got 13 periods, if you use a 4-4-5 convention, or if you’ve got anything other than 12 calendar months defined as your fiscal periods.
Comparison date, what the heck’s it good for?
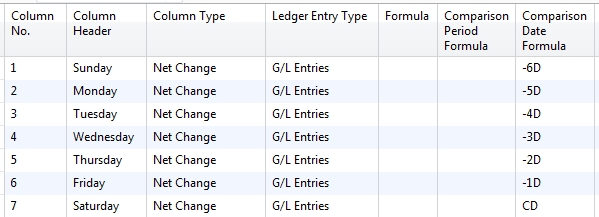
Despite everything you’ve read above, comparison date does have one really good use, and that is if you need to report on something on a daily or even weekly basis. Comparison period can’t go below the fiscal period unit, but comparison date sure can. Here’s an example of a column layout that defines time periods of daily for a week. Remember, in order for this to work, the date filter needs to be set to the last day of the week.
Where can I learn more about comparison period and comparison date?
Visit the Account Schedules Formulas page of this blog. This page was developed to answer the many questions I have gotten in my account schedules classes about what else you can do using comparison period. The entire page is full of screen shots, just like the ones you see above, so you can reference them or even copy them exactly, as you create your own account schedules.
This posting is part of the NAV Account Schedules 101 series. Find the entire list of lessons here.
Don’t forget to visit the Account Schedule Formulas and Account Schedule Examples pages if you’re looking for even more ideas on how to improve your financial reporting using account schedules with Microsoft Dynamics NAV.
Week Four Recap: Account Schedules 101
Posted: May 9, 2014 Filed under: Uncategorized Leave a comment Here’s the week 4 recap on the NAV Account Schedules 101 series. Follow the links below to view the posts for each of the lessons we covered this week or view the entire series here.
NAV AS 101 Lesson 8: Formatting
Don’t forget to visit the Account Schedule Formulas and Account Schedule Examples pages if you’re looking for even more ideas on how to improve your financial reporting using account schedules with Microsoft Dynamics NAV.
NAV AS 101 Lesson 9: Formulas
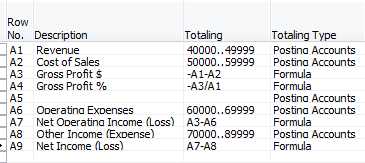
Posted: May 9, 2014 Filed under: Uncategorized Leave a commentFormulas in Microsoft Dynamics NAV Account Schedules are the hardest concept for most users to grasp, because their use is just not intuitive. There are a few basic concepts that can help get you started.
When getting started with a row setup, you need to choose either Posting Accounts or Formula in the Totaling Type column. These two options indicate whether you will be pulling numbers from general ledger accounts (posting accounts) or calculating against other rows (formula). There is another option Total Accounts that lets you pull numbers from total accounts from your chart of accounts instead if you are using total accounts instead of or in addition to posting accounts. Once you have defined your option in the Totaling Type column, then you need to populate the Totaling column with either general ledger accounts or formulas, depending on what you have chosen.
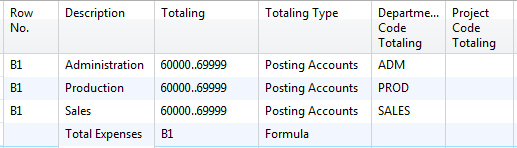
If you are a dimension user, you need to expand your selections to specific columns available in the row setup for dimensions. These are Dimension Totaling columns. The two global dimensions will always be available for use, but any other dimensions will appear with a label that is Dimension 3 Totaling or Dimension 4 Totaling (etc.) until you define which specific dimensions you want account schedules to use by defining them in analysis views. By filtering on dimensions in these columns, you can report at a deeper level and break down the segments of general ledger accounts to their dimension components in your financial reporting.
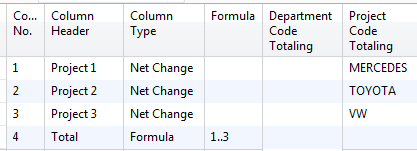
When getting started with a column layout, you need to choose either a definition of time like Net Change or Balance at Date or Formula in the Column Type column. These two options indicate whether you will be pulling numbers from general ledger accounts (posting accounts) or calculating against other columns (formula). If you have chosen Formula as your Column Type, you need to fill in the formula. The same options for Dimension Totaling are available here, just as they are for the row setup.
All the rest of the information you need about account schedule formulas happens in the Comparison Period Formula and Comparison Date Formula columns. There’s so much information there, we need to address it in a post of it’s own. Stay tuned, it’s coming up next!
This posting is part of the NAV Account Schedules 101 series. Find the entire list of lessons here.
Don’t forget to visit the Account Schedule Formulas and Account Schedule Examples pages if you’re looking for even more ideas on how to improve your financial reporting using account schedules with Microsoft Dynamics NAV.
NAV AS 101 Lesson 8: Formatting
Posted: May 8, 2014 Filed under: Uncategorized Leave a commentFormatting options for Microsoft Dynamics NAV are pretty basic, but there are a few tricks you should know to get the most out of what you have. Because very little has changed with formatting options in newer versions I’ll show some basics in NAV 2009 Classic, but highlight some expanded features in NAV2009 RTC and NAV2013 so you know the full range of what you can use.
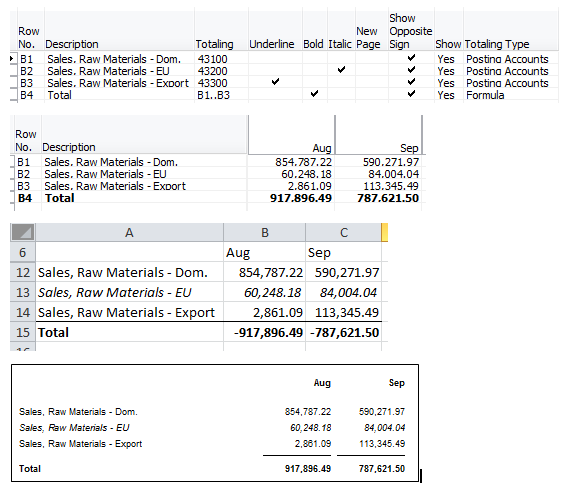
This is an example showing the row setup, screen view, Excel export, and printed views with no formatting of any type assigned. It’s pretty ugly no matter which way you look at it.
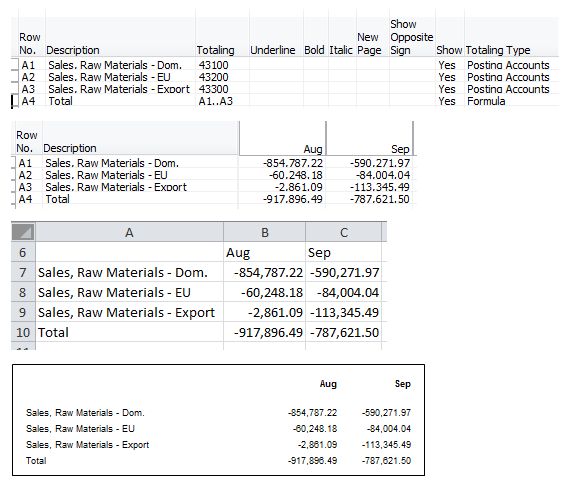
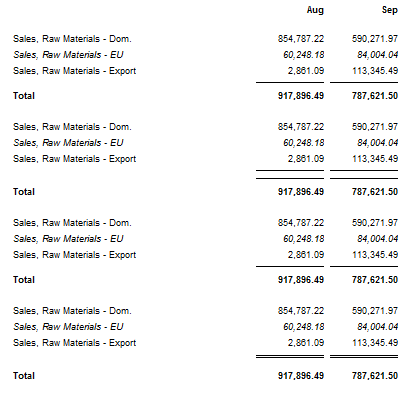
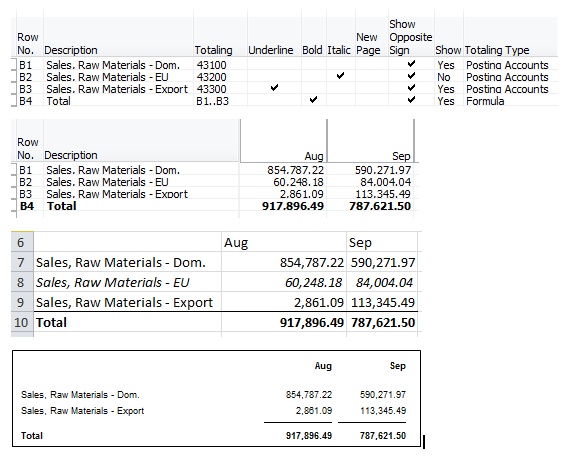
Let’s make this look better by applying some basic formatting options. We’ll bold the total line, underline the line above the total, italicize the second line, and choose show opposite sign on all the revenue lines, including the total line, so our sales are reflected as a positive number instead of as a credit balance. Looking better already, but there are a few things going on that need to be explained.
Underline – Can’t see it on the screen view, appears across the entire page including row descriptions in Excel export, and shows just under the numbers in the printed view.
Italic – Can’t see it on the screen view, but can see it on both the Excel export and printed view.
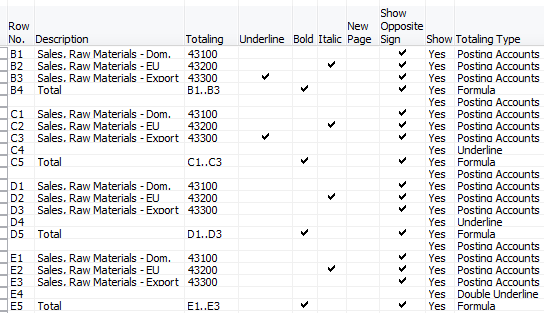
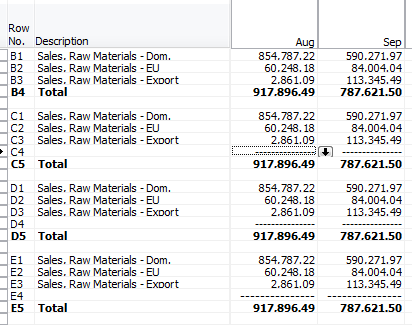
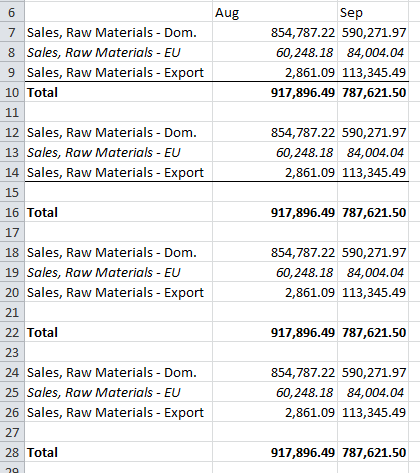
We can improve on what’s going on with the underline with a few additional options. There is an option in the totaling type column for underline, and after NAV2009 SP1, there is an option for double underline. The screen shots below show the following differences. Notice they don’t make much of a difference at all on the screen view or Excel export versions, and have the largest impact on the printed version. NAV2013 has a new additional checkbox for double underline, but it still behaves the same way, only showing up on the printed version.
B – Just the underline checkbox is checked. If you want the underline situated tightly to your numbers without extra space in the printed view, this is the way to do it.
C – The underline checkbox is checked and the totaling type of underline is selected. This gives a wide double underline in the printed view only.
D – The totaling type of underline is selected. If you want a little bit of space below your numbers before the underline appears in the printed view, this is the way to do it.
E – The totaling type of double underline is selected.
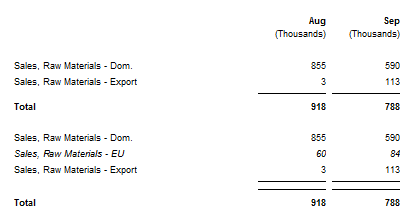
Similar to what we see with the different underline options, the show option also has limited utility. Let’s choose No instead of Yes on the second line of our example and see what we get. As you can see, the show option only hides a line in the printed view. There is actually a show option that is also available in the column layout, but again, it only hides a column in the printed view.
There is one additional formatting option that only exists in the column layout – the rounding factor. Selecting this option, just like show, only allows the changes to go through to the printed version, but if you are using that option you can round to a factor of 1, 1000 or 1000000.
One last option here that I haven’t put together an example for is the New Page option. Use this option if you need to insert a page break anywhere in your report. I’ve seen lots of companies use this to produce a two page balance sheet. I’ve also seen companies build some pretty large multi-page account schedules in one named report and break each page by using this option. I think it is easier to maintain and update short simple reports if at all possible, so I recommend creating a few (or many!) separate account schedules instead of doing this. It’s just too easy to miss something, or at least spend a lot of time looking for, something you need to update in a large multi-page report kept in a single account schedule.
This posting is part of the NAV Account Schedules 101 series. Find the entire list of lessons here.
Don’t forget to visit the Account Schedule Formulas and Account Schedule Examples pages if you’re looking for even more ideas on how to improve your financial reporting using account schedules with Microsoft Dynamics NAV.
Week Three Recap: Account Schedules 101
Posted: May 2, 2014 Filed under: Uncategorized Leave a commentHere’s the week 3 recap on the NAV Account Schedules 101 series. Follow the links below to view the posts for each of the lessons we covered this week or view the entire series here.
NAV AS 101 Lesson 6: Row Setup
NAV AS 101 Lesson 7: Column Layout
Don’t forget to visit the Account Schedule Formulas and Account Schedule Examples pages if you’re looking for even more ideas on how to improve your financial reporting using account schedules with Microsoft Dynamics NAV.
NAV AS 101 Lesson 7: Column Layout
Posted: May 1, 2014 Filed under: Uncategorized 1 CommentThe column layout is where you will define periods of time to be used in your reports. Most financial reports are showing us some period of time compared to the data (in this case, general ledger accounts) we are reporting against. You can apply any column layout you design against any of the row setups you design. As an example, when I produce my income statement, I will have one row setup that reflects a summarized income statement and at least four different column layouts that reflect different configurations of month to date, year to date, comparisons against budget, and twelve month trended views.
Just like with row setups, there are many available options in the column layouts. This large variety of options can sometimes be overwhelming to the new account schedule user. I’ll show you which columns to choose in the column layouts for account schedules as a beginning point, and go through some simple explanations of how they are used.
Fields for beginning users of account schedules:
Column No. – The column number is completely optional, but highly recommended. This simple element of the column layout will eventually be one of the key features of your account schedule, allowing you to calculate and organize with ease.
Column Header – This is where you’ll define, in words, what you’re showing in each column of your report. Keep it short; there is a 30 character limit.
Column Type: Net Change, Balance at Date, or Formula – Limit yourself to these three options when you’re just getting started. The key here is knowing what type of accounts you’re reporting on. If you’re using income statement accounts (Revenue/Expense), then you need to use net change. If you’re using balance sheet accounts (Assets/Liabilities), then you need to use Balance at Date. Formula allows you to perform calculations in a column.
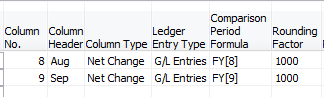
Ledger Entry Type – This column will allow you to define what type of ledger entries you will show. This is where you can choose actual general ledger entries or budgeted general ledger entries.
Formula – If you’ve chosen Formula as the Column Type, this is where you’ll put the formula.
Comparison Period Formula – This column allows you to define date formulas that are used to calculate the amounts shown. I generally recommend that beginning account schedule users start out using the comparison period formula field instead of the comparison date formula field. The comparison period formula field references the accounting periods set up in the fiscal year, so this option seems the most consistent, and is especially necessary for companies that may not follow a calendar fiscal year. Common data labels used in this field are CP for current period or -1P for previous period and FY for fiscal year or -1FY for prior year.
Shown below are both the design view and the user view of a column layout for a summarized income statement showing year to date and prior year to date information in the columns to demonstrate the use of these six basic options in an account schedule.
Role Tailored Client / 2013


Classic Client


Fields for experienced users of account schedules:
If you’re looking for what else you can do with Microsoft Dynamics NAV column layouts, then this is where you want to be. Keep reading to understand each and every field available for account schedule column layouts. The functionality of these fields are exactly the same between the Classic and Role Tailored Clients unless specifically noted. The only difference is in how they look on the screen and how you navigate between screens. Take a look at the pictures below to find the look you’re familiar with, but then keep reading for the explanations of what these fields will do in your financial reporting.
Role Tailored Client / 2013
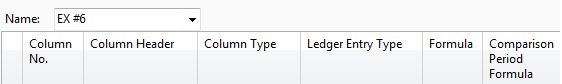
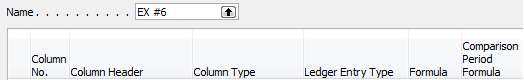
This is a view of what I recommend you start with for basic column layout options.
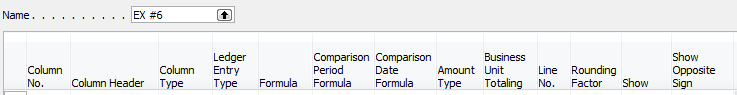
This is a view of all available column layout options (click on the picture for a larger view).

Classic Client _________
This is a view of what I recommend you start with for basic column layout options.
This is a view of all available column layout options (click on the picture for a larger view).
Column layout options – apply to both clients
Column No. – The column number is completely optional, but highly recommended. This simple element of the column layout will eventually be one of the key features of your account schedule, allowing you to calculate and organize with ease.
Column Header – This is where you’ll define, in words, what you’re showing in each column of your report. Keep it short; there is a 30 character limit.
Column Type: 7 options to choose from
- Formula allows you to perform calculations in a column.
- Net Change should be used, generally, if you’re reporting on income statement accounts (revenue/expense).
- Balance at Date should be used, generally, if you’re reporting on balance sheet accounts (assets/liabilities).
- Beginning Balance will be sparingly used, but you’ll want this for your statement of cash flows at some point.
- Year to Date should be used to show a total in the column of the balance from the start of the year through the current filtered date.
- Rest of Fiscal Year can be used to show, for budgeted information, what is planned for the remainder of the fiscal year.
- Entire Fiscal Year can be used to show, for budgeted information, what has been planned for the entire fiscal year.
Ledger Entry Type – This column will allow you to define what type of ledger entries you will show. This is where you can choose actual general ledger entries or budgeted general ledger entries.
Formula – If you’ve chosen Formula as the Column Type, this is where you’ll put the formula.
Comparison Period Formula – This column allows you to define date formulas that are used to calculate the amounts shown. I generally recommend that beginning account schedule users start out using the comparison period formula field instead of the comparison date formula field. The comparison period formula field references the accounting periods set up in the fiscal year, so this option seems the most consistent, and is especially necessary for companies that may not follow a calendar fiscal year. Common data labels used in this field are CP for current period or -1P for previous period and FY for fiscal year or -1FY for prior year.
Comparison Date Formula – This column allows you to define date formulas that are used to calculate the amounts shown. However, the comparison date formula field references the calendar months of the year instead of the accounting periods set up in the fiscal year. Common data labels used in this field are CM for current month or -1M for previous period and CY for calendar year and -1Y for prior calendar year.
Amount Type gives you three options: Net Amount, Debit Amount and Credit Amount. You’re going to use Net Amount almost all the time, but I suppose if you were getting very granular in your account schedules and perhaps using them for detailed reconciling reports, this might be useful. If I’m getting down to this level of transactional detail, I’m usually going to the chart of accounts instead of account schedules.
Business Unit Totaling acts like a bonus dimension when producing consolidated financial statements from more than one company, designating a unique business unit per company.
Cost Center Totaling and Cost Object Totaling *New with NAV2013* These are new functions related to totaling of new cost center and cost objects.
Line No. is automatically designated by the software.
Rounding can be set for none, 1, 1000, or 1000000. Just like the show function, this only affects numbers shows on the printed account schedule. You’ll still see numbers rounded to two decimals on-screen or when you export to Excel.
Show allows you to designate if a row will show (the default) or be hidden on the printed account schedule only. You can click this box as much as you want, but your rows will still show on-screen or when you export to Excel. If you print directly out of account schedules, this feature will work very well for you.
Show Opposite Sign is the option you can select to change revenue credit balances or expense debit balances to the opposite sign for the purposes of presenting this data in a more non-finance friendly manner. No salesperson wants to see sales presented with a negative sign; use this to change that credit to a positive number on your reporting.
Dimension Totaling is the last option available and you might have noticed that I didn’t show them on pictures above. This is because they are unique for just about every user, and depending on your analysis view setup, may even be different from schedule to schedule. You can use just one, or you can use all four of the available dimension totaling fields, in whatever combination you like. These fields act very much like the Totaling field because this is where you will tell NAV what Dimensions you want shown and totaled from your general ledger accounts.
This posting is part of the NAV Account Schedules 101 series. Find the entire list of lessons here.
Don’t forget to visit the Account Schedule Formulas and Account Schedule Examples pages if you’re looking for even more ideas on how to improve your financial reporting using account schedules with Microsoft Dynamics NAV.
NAV AS 101 Lesson 6: Row Setup
Posted: April 29, 2014 Filed under: Uncategorized Leave a commentThe row setup is the area of the report where you’ll show either single general ledger accounts or groups of general ledger accounts. If you imagine a trial balance, the rows of a trial balance correspond to single general ledger accounts. The row setup of an income statement would be an example of where you might use groups of general ledger accounts.
The perpetual problem of the new NAV user is when you get started in a new area of the application, there are way too many options to choose from. How many times have you opened up a new menu option, only to find twenty or more columns displayed as the default, and many more lurking behind the show columns menu? While we appreciate having all options for all people at some point, new users can find this especially daunting when trying to just get started with something new.
I’ll show you which columns to choose in the row setup for account schedules as a beginning point, and go through some simple explanations of how they are used.
Fields for beginning users of account schedules:
Row No. – The row number is completely optional, but highly recommended. This simple element of the row setup will eventually be one of the key features of your account schedule, allowing you to calculate and organize with ease.
Description – This is the one place you have to communicate, in words, what you’re showing on each line of your report.
Totaling Type: Posting Accounts or Formula – This field tells NAV what you’re going to do here. You’re either going to pull data from your general ledger posting accounts or calculate a formula.
Totaling – Which general ledger accounts you want to pull or what formula you want to calculate.
Row Type: Net Change or Balance at Date – The key here is knowing what type of accounts you’re reporting on. If you’re using income statement accounts (Revenue/Expense), then you need to use net change. If you’re using balance sheet accounts (assets/liabilities), then you need to use Balance at Date.
Shown below are both the design view and the user view of a summarized income statement, showing the use of these five options.
Role Tailored Client / 2013


Classic Client


Fields for experienced users of account schedules:
If you’re looking for what else you can do with Microsoft Dynamics NAV row setups, then this is where you want to be. Keep reading to understand each and every field available for account schedule row setups. The functionality of these fields are exactly the same between the Classic and Role Tailored Clients unless specifically noted. The only difference is in how they look on the screen and how you navigate between screens. Take a look at the pictures below to find the look you’re familiar with, but then keep reading for the explanations of what these fields will do in your financial reporting.
Role Tailored Client / 2013
This is a view of what I recommend you start with for basic row setup options.

This is a view of all available row setup options.

Classic Client
This is a view of what I recommend you start with for basic row setup options.

This is a view of all available row setup options.

Row setup options – apply to both clients
Row No. is completely optional, but highly recommended. This simple element of the row setup will eventually be one of the key features of your account schedule, allowing you to calculate and organize with ease.
Description is the one place you have to communicate, in words, what you’re showing on each line of your report.
Totaling Type: 10 options to choose from
- Posting Accounts pull data from your accounts designated as posting accounts on the G/L Account Card Account Type field.
- Total Accounts pull data from your accounts designated as a total or as an end-total on the G/L Account Card Account Type field.
- Formula allows you to calculate a basic formula on this row.
- Underline places a single underline.
- Double Underline places a double underline.
- NOTE: This nifty addition showed up with NAV 2009 R2. If you are NAV 2009 SP1 or earlier, this won’t be available to you.
- Both of the underline functions are there to give folks who print account schedules directly out of NAV some formatting options. If you’re exporting to Excel you’ve got some better format options to work with than these.
- Set Base for Percent allows you to designate which row from your row setup will be used as the beginning point for a section to be included in a percent of total calculation. This feature showed up in version 5.0 and must be used together with a formula on another row to designate the end point of the section as well as some setup in the column layout. It’s a little fussy in the setup and inelegant in execution, but is still effective to get those vital comparative percentages onto your account schedules.
- Cost Type and Cost Type Total *New with NAV2013* These are new functions related to the posting accounts and total and end-total accounts from the chart of cost accounts.
- Cash Flow Entry Accounts and Cash Flow Total Accounts *New with NAV2013* These are new functions related to the posting accounts and total and end-total accounts from the chart of cash flow accounts.
Totaling will be which general ledger accounts you want to pull or what formula you want to calculate, depending on what you selected in totaling type.
Row Type: 3 options to choose from
- Net Change should be used, generally, if you’re reporting on income statement accounts (revenue/expense).
- Balance at Date should be used, generally, if you’re reporting on balance sheet accounts (assets/liabilities).
- Beginning Balance will be sparingly used, but you’ll want this for your statement of cash flows at some point.
Amount Type gives you three options: Net Amount, Debit Amount and Credit Amount. You’re going to use Net Amount almost all the time, but I suppose if you were getting very granular in your account schedules and perhaps using them for detailed reconciling reports, this might be useful. If I’m getting down to this level of transactional detail, I’m usually going to the chart of accounts instead of account schedules.
Formatting Fields: Bold, Italic, and Underline These basic formatting fields are there to allow you to emphasize some of the rows of your account schedules. When you select these options on any row, the whole row is effected. You are not able to effect a single “cell” for formatting. What’s the difference between underline here and underline found in the Totaling Type options? You can get a more snug fit on your underline using this option since it appears in the same row of your data instead of in a row if its own.
New Page inserts a page break. This is commonly used when separating the pages of the balance sheet showing assets on the first page and liabilities and equity on the second page. I have also seen it used when folks build multi page account schedules.
Show Opposite Sign is the option you can select to change revenue credit balances or expense debit balances to the opposite sign for the purposes of presenting this data in a more non-finance friendly manner. No salesperson wants to see sales presented with a negative sign; use this to change that credit to a positive number on your reporting.
Show allows you to designate if a row will show (the default) or be hidden on the printed account schedule only. You can click this box as much as you want, but your rows will still show on-screen or when you export to Excel. If you print directly out of account schedules, this feature will work very well for you.
Dimension Totaling is the last option available and you might have noticed that I didn’t show them on pictures above. This is because they are unique for just about every user, and depending on your analysis view setup, may even be different from schedule to schedule. You can use just one, or you can use all four of the available dimension totaling fields, in whatever combination you like. These fields act very much like the Totaling field because this is where you will tell NAV what Dimensions you want shown and totaled from your general ledger accounts.
This posting is part of the NAV Account Schedules 101 series. Find the entire list of lessons here.
Don’t forget to visit the Account Schedule Formulas and Account Schedule Examples pages if you’re looking for even more ideas on how to improve your financial reporting using account schedules with Microsoft Dynamics NAV.
Week Two Recap: Account Schedules 101
Posted: April 25, 2014 Filed under: Uncategorized Leave a commentHere’s the week 2 recap on the NAV Account Schedules 101 series. Follow the links below to view the posts for each of the lessons we covered this week or view the entire series here.
NAV AS 101 Lesson 4: Basic Elements of Account Schedules
NAV AS 101 Lesson 5: Getting Started
BONUS WEBINAR – I did a repeat of a NAVUG sponsored Convergence session from this last March titled, “Basic Financial Reporting with Account Schedules”. The one hour session covered some account schedule basic concepts, but also shows how to look at an income statement nine different ways with live demonstrations done in a NAV2013 database. The webinar is recorded and will be available for viewing out on Collaborate if you have a premium NAVUG membership. I’ll update the link here once the recording is available.
Don’t forget to visit the Account Schedule Formulas and Account Schedule Examples pages if you’re looking for even more ideas on how to improve your financial reporting using account schedules with Microsoft Dynamics NAV.
")

